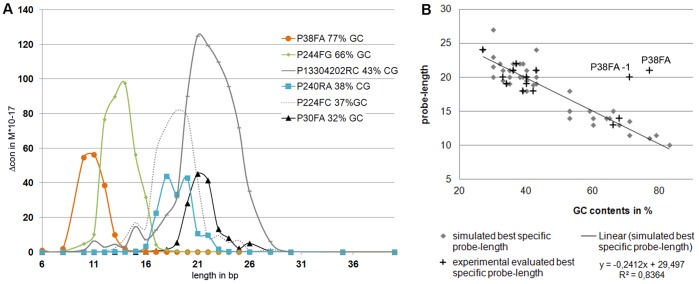
Figure 5. Influence of the G/C contents on Δcon and HSE success.
(A) Comparison of Δcon from six core probes with different G/C content. For all probe sets, G/C content has been calculated as a mean value for all simulated probe lengths. (B) Diagram showing the linear dependence of probe length and G/C content for optimum specific probes after simulation and HSE extraction. Data points are based on Table 2. Diamonds represent the length and G/C content of probes with the highest simulated Δcon (n = 48), crosses indicate length and G/C content of the probe with the best HSE success (n = 11, grey boxes in Table 2A).

