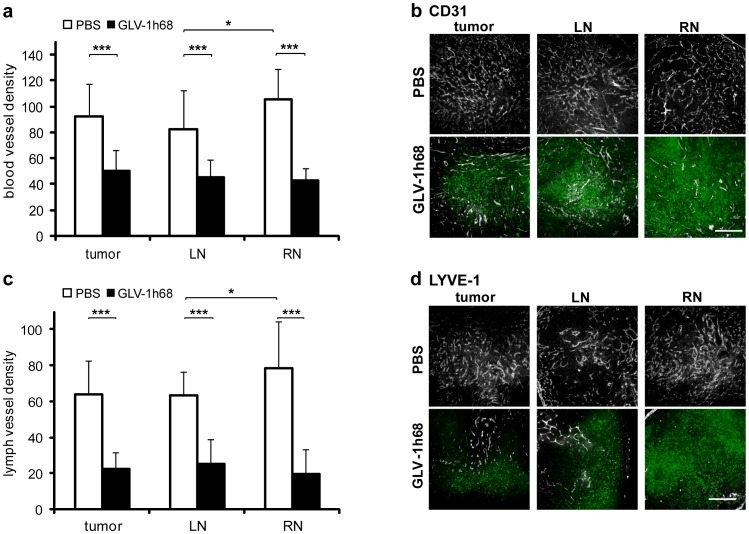
Figure 2. Blood and lymph vessel density in PC-3 tumors and lymph node metastases.
Analysis was performed 57 days after implantation of 2×10⁶ PC-3 cells and 7 days after injection of 1×10⁷ pfu GLV-1h68. To determine blood and lymph vessel density, 100 µm sections of tumors, LNs and RNs of 5 PBS- and 5 GLV-1h68-treated mice were stained with anti-CD31 or anti-LYVE-1 antibody. Blood and lymph vessels were counted in 4 images (×100 magnification) from each of 2 sections per sample. (a) Blood vessel density in PC-3 tumors/metastases and (b) representative images of anti-CD31 stained sections. Blood vessels are shown in grayscale, by GLV-1h68 expressed GFP in green. (c) Lymph vessel density in PC-3 tumors/metastases and (d) representative images of anti-LYVE-1 stained sections. Lymph vessels are shown in grayscale, by GLV-1h68 expressed GFP in green. Scale bars represent 500 µm.

