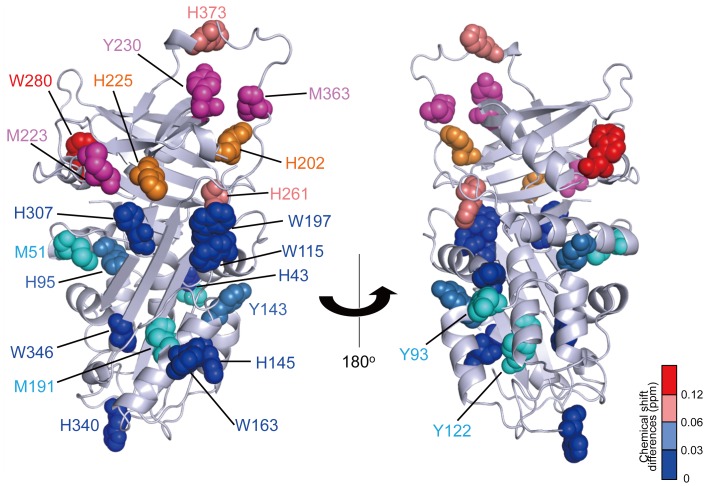
Figure 4. Mapping of the collagen-binding site of Hsp47 in the 3D-structural model.
The tryptophan and histidine residues are mapped on the 3D-homology model of Hsp47 with a space-filling representation. Colors indicate the strength of the perturbation [(0.04Δδ N 2+Δ δ H 2)1/2, where δ N and δ H represent the difference in nitrogen and proton chemical shifts, respectively] upon addition of the trimeric collagen peptide as follows: >0.12 ppm (red), 0.12 - 0.06 ppm (salmon pink), 0.06 - 0.03 ppm (sky blue), and <0.03 ppm (blue). The histidine residues whose peak intensity attenuations to an undetectable level upon addition of the peptide are shown in orange. The methionine and tyrosine residues are mapped with a space-filling representation according to the mutational effects on collagen-binding affinities observed as follows: >30% (magenta), and <10% (cyan) reductions upon mutations.

