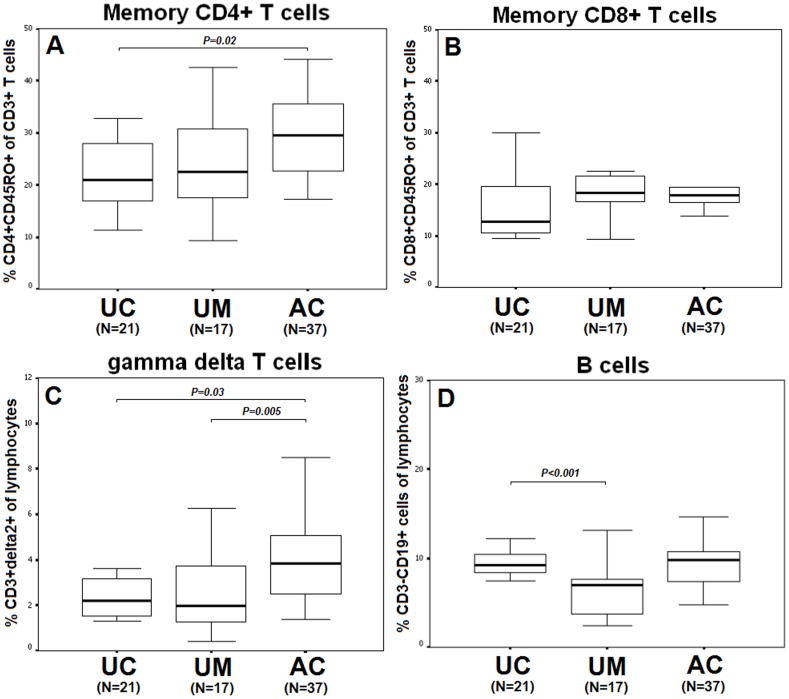
Figure 1. Comparison of memory CD4+ T cell (A) and CD8+ T cell (B), gamma delta T cell (C) and B cell (D) phenotypes between unexposed controls (UC:N = 21), uninfected malaria-exposed subjects (UM: N = 17), and patients with acute P. vivax infection (AC:N = 37).
Data are represented as median, inter-quartile ranges (box plots) and maximum and minimum (upper-lower lines).

