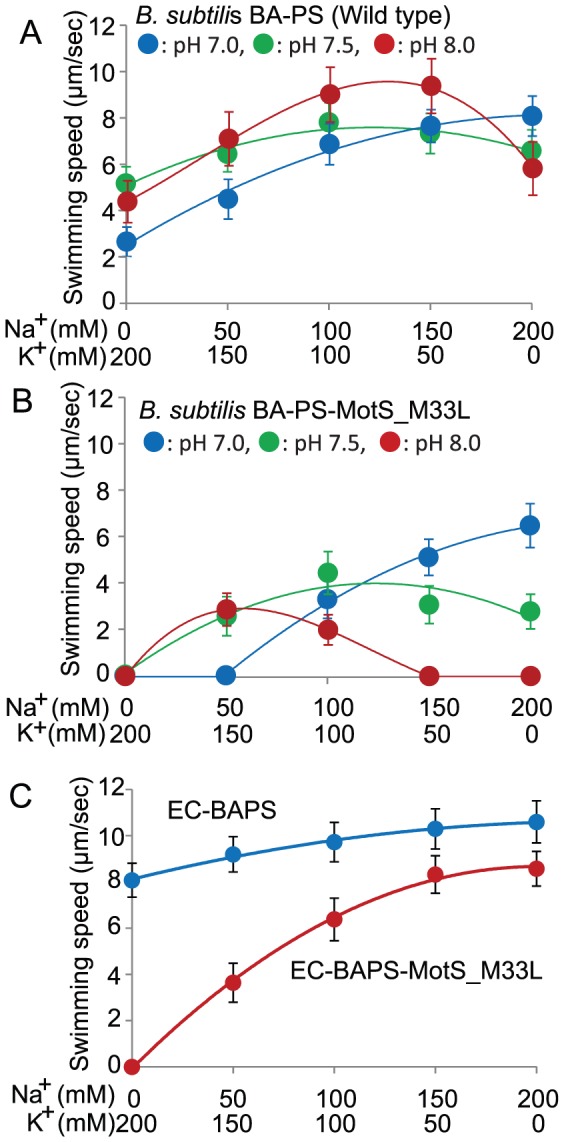
Figure 6. The effect of KCl and NaCl on swimming speed of B. subtilis and E.coli strains.

The effect of KCl and NaCl on swimming speed of B. subtilis strains (A) and (B), The velocity was measured at several different pH values in phosphate buffer that contained 200 mM Na+, 150 mM Na+ plus 50 mM K+, 100 mM Na+ plus 100 mM K+, 50 mM Na+ plus 150 mM K+, or 200 mM K+. The blue line and blue filled circles, the green line and green filled circles, and the red line and red filled circles show the data at pH 7.0, 7.5, and 8.0, respectively. The effect of KCl and NaCl on swimming speed of E. coli strain (C) The velocity was measured at pH 7.0 in phosphate buffer that contained 200 mM Na+, 150 mM Na+ plus 50 mM K+, 100 mM Na+ plus 100 mM K+, 50 mM Na+ plus 150 mM K+, or 200 mM K+. The blue line and blue filled circles and the red line and red filled circles show the data for EC-BAPS and EC-BAPS-MotS_M33L, respectively. The swimming speed was determined as described in the Materials and Methods section. The results that are shown represent the averages of three independent experiments in each of which the swimming speeds of 20 independent cells as calculated in each experiment. The error bars indicate the standard deviations of the values.
