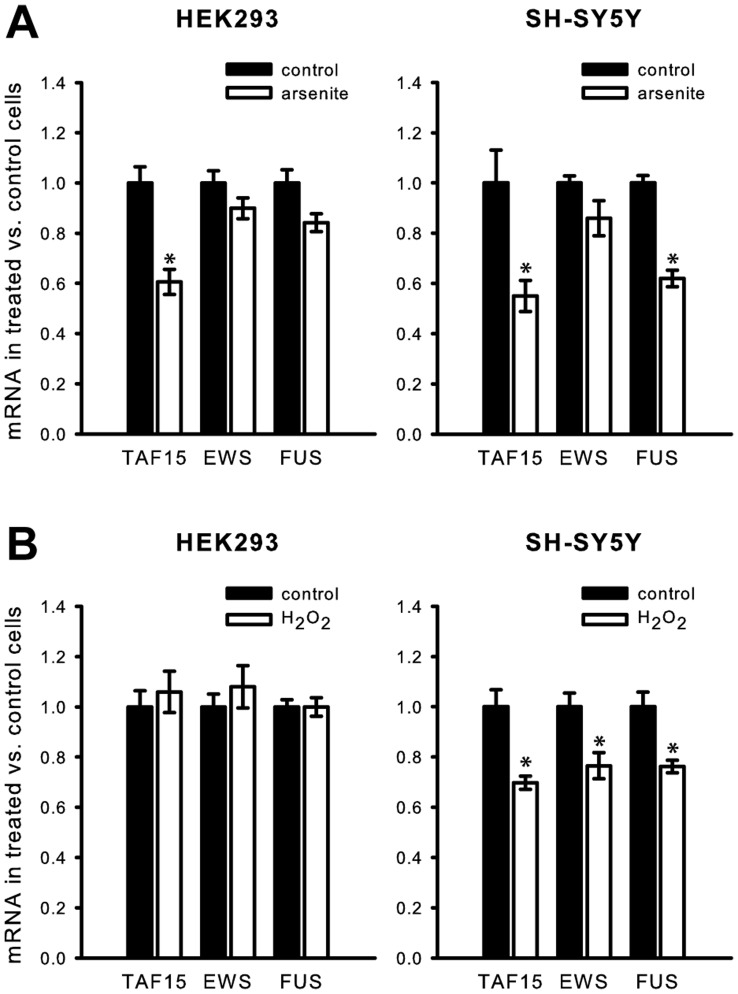
Figure 4. RT-qPCR of the FET mRNA expression in HEK293 and SH-SY5Y cells after oxidative stress.
The FET mRNA levels were normalized to the expression of GAPDH and quantified to the FET mRNA level in unstressed cells according to the X0-method [45]. (A) Arsenite induced cellular stress. *, P<0.001. **, P<0.01. (B) H2O2 induced cellular stress. *, P<0.005. **, P<0.01.

