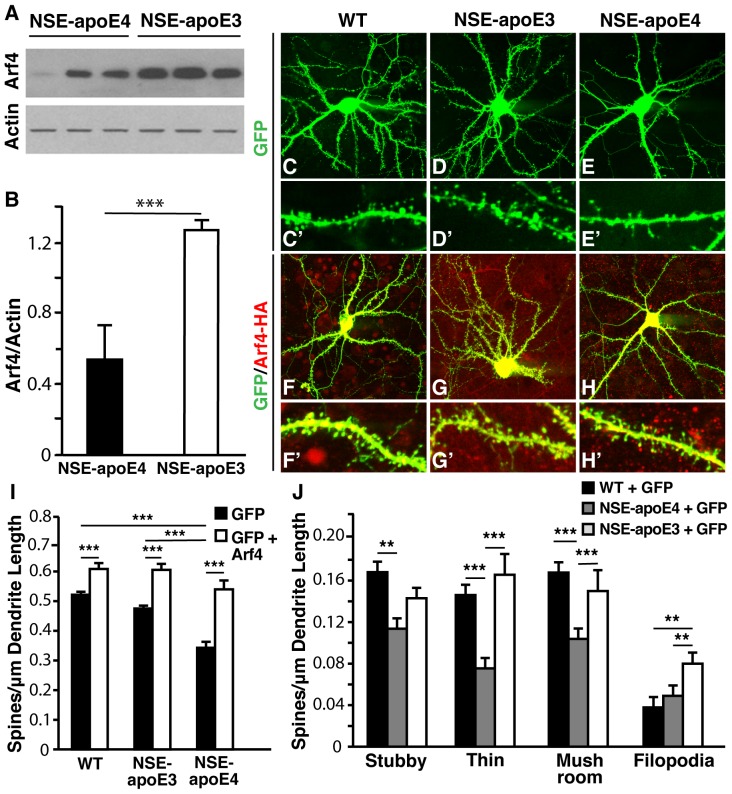
Figure 12. Arf4 overexpression rescues spine loss in apoE4-expressing primary neurons.
(A) Representative Western blot of actin and Arf4 levels in NSE-apoE4 and -apoE3 mice reveal a decrease in Arf4 protein levels from NSE-apoE4 mice compared to those from NSE-apoE3 mice. Primary neuron lysates were prepared in triplicate, and actin was used as a loading control. (B) Quantification of the ratio of Arf4/Actin levels. Data are mean±SD. * p<0.05, *** p<0.001. (C–H′) Primary hippocampal and cortical neurons were cultured from WT, homozygous NSE-apoE3, or homozygous NSE-apoE4 mouse E18−E19 embryos. Neurons were transfected with FUGW2 plasmid alone (for visualization of spines) or with FUGW2 plus Arf4-HA-WT at DIV5 and analyzed at DIV14. Lower (C−H) and higher (C′−H′) magnification images are shown. (C–E′) WT (C–C′), NSE-apoE3 (D–D′), or NSE-apoE4 (E–E′) neurons transfected with empty FUGW2 plasmid (n = 12–13 neurons). (F–H′) WT (F–F′), NSE-apoE3 (G–G′), or NSE-apoE4 (H–H′) neurons cotransfected with FUGW2 plus Arf4-HA-WT (n = 8–12 neurons). (I) Quantification of total spine densities for each experimental condition. (J) Spine subtype densities for each experimental condition. All data are mean±SEM. * p<0.05, ** p<0.01, *** p<0.001.

