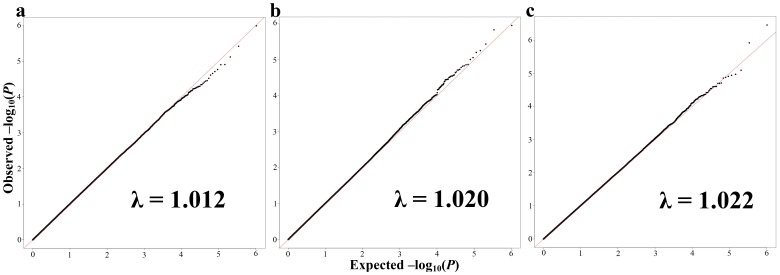
Figure 1. Genome-wide QQ plots of expected and observed –log(P) values for all SNPs analyzed in linear regression covariate-adjusted models for the selected four-year neuropsychological domains.
Panel A presents the QQ plot for the phenotype, ADHD-IV Impulsivity Scale. Panel B presents the QQ plot for the phenotype, CBCL/1.5-5 PDPs. Panel C presents the QQ plot for the phenotype, CBCL/1.5-5 Total Problems. λ = genomic inflation factor.

