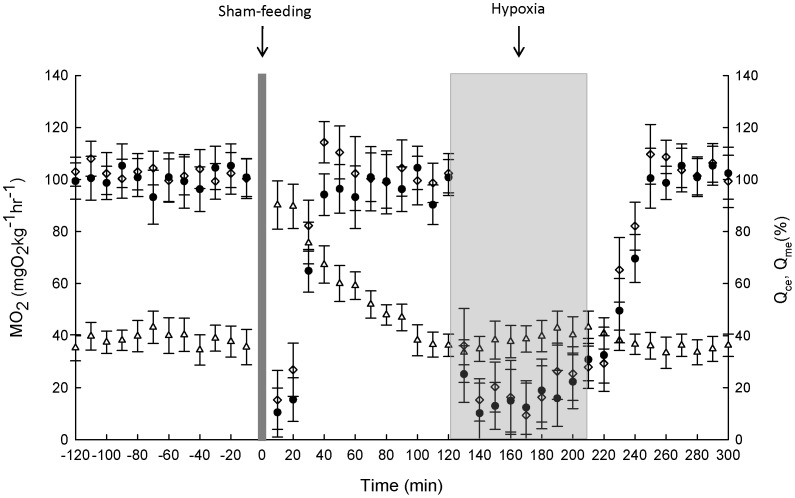
Figure 1. Respiratory and cardiovascular responses to sham-feeding and hypoxic exposure.
G. morhua were sham-fed at time zero and exposed to 90 min of 35% O2 saturation (grey area) 2 hr post sham-feeding. The variables are oxygen uptake (MO2, open triangles) and coeliac (Qce, open diamonds) and mesenteric (Qme, filled circles) blood flow. Values are mean ± SE, n = 5.

