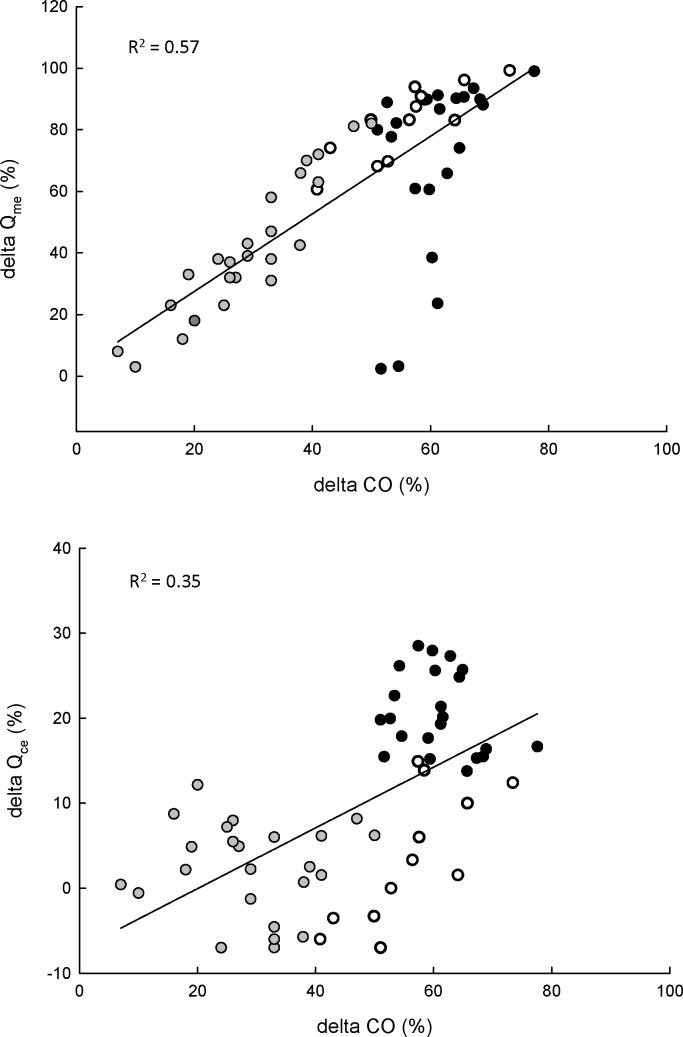
Figure 3. Relationship between postprandial CO and Qce and Qme, respectively.
G. morhua were force-fed 2% of their body mass and the variables are postprandial changes in respectively mesenteric blood flow (delta Qme) and coeliac (delta Qce) in relation to postprandial changes in cardiac output (delta CO). Data are from fish exposed solely to normoxia, and the black, the white and the grey circles represent values from 3–24 h, 25–36 h and 37–60 h postpranfial, respectively.

