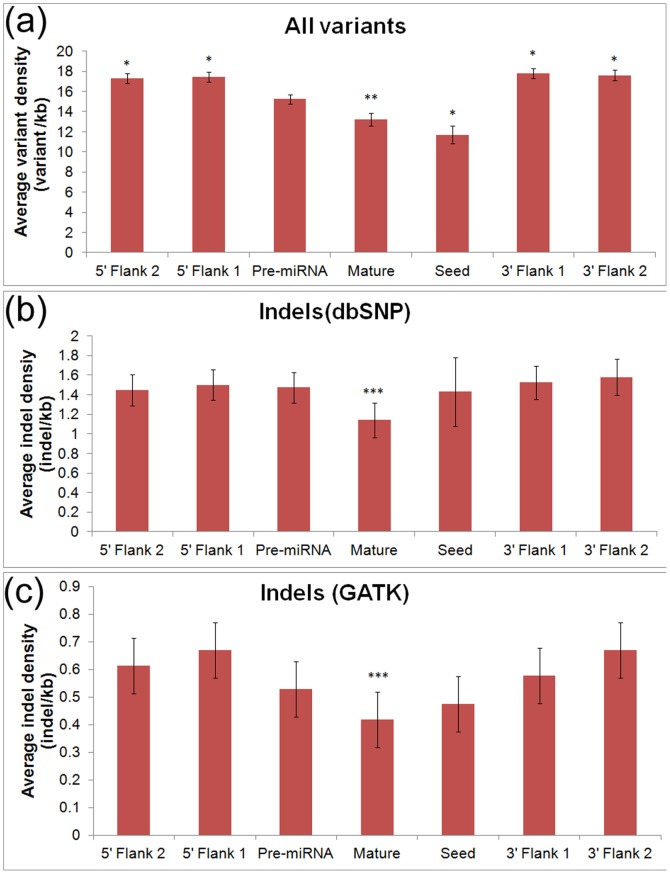
Figure 1. Density of all genetic variants (a) and indels (b) in dbSNP 135 as well as indels (c) from the GATK resource bundle in pre-miRNAs, mature miRNAs, miRNA seed regions, and flanking regions.
Flanking regions 1 and 2 represent successive sequences adjacent to pre-miRNAs that were equal to the length of the pre-miRNA (∼100 bp). Error bars indicate the standard error. The density of all genetic variants (a) in pre-miRNAs was significantly different from the density in flanking regions, mature miRNAs, and seed regions (*p<0.01, **0.01<p<0.05). The density of indels in mature sequences (b) and (c) was significantly different than the density calculated by averaging across all four flanking regions (***0.01<p<0.05).

