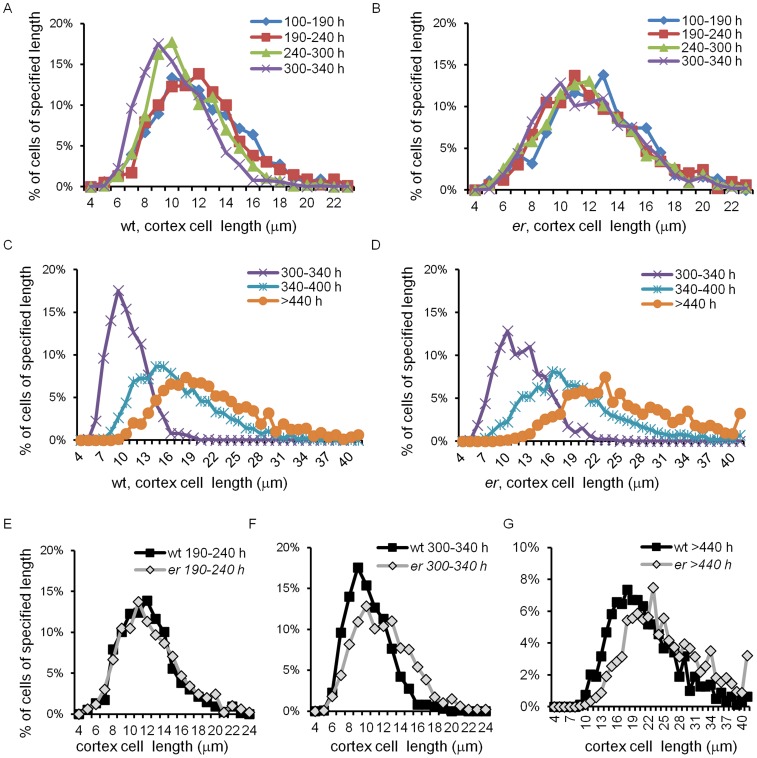
Figure 7. Cortex cell size distribution in pedicels of different ages in the wild type and er.
Data points represent percentage of cells of specified length range, e.g. data point at 6 µm represents the percentage of cells 5 to 6 µm long. All bins are equal of 1 µm. The last bin on C, D and G represent cells >40 µm long. Data series represent pedicels of different ages and are color coded. Age of pedicels is given in hours (e.g. 100–190 h). The wild type cell size distribution is given in A and C and the er cell size distribution in B and D. Cortex cells from the wild type and er pedicels of the same age are compared in E, F and G. Number of cells in distributions: 100–190 h and 190–240 h between 327 and 757; 240–300 h and 300–340 h between 929 and 1020; 340–400 h 2098and 2856; >440 h 790 and 1364.

