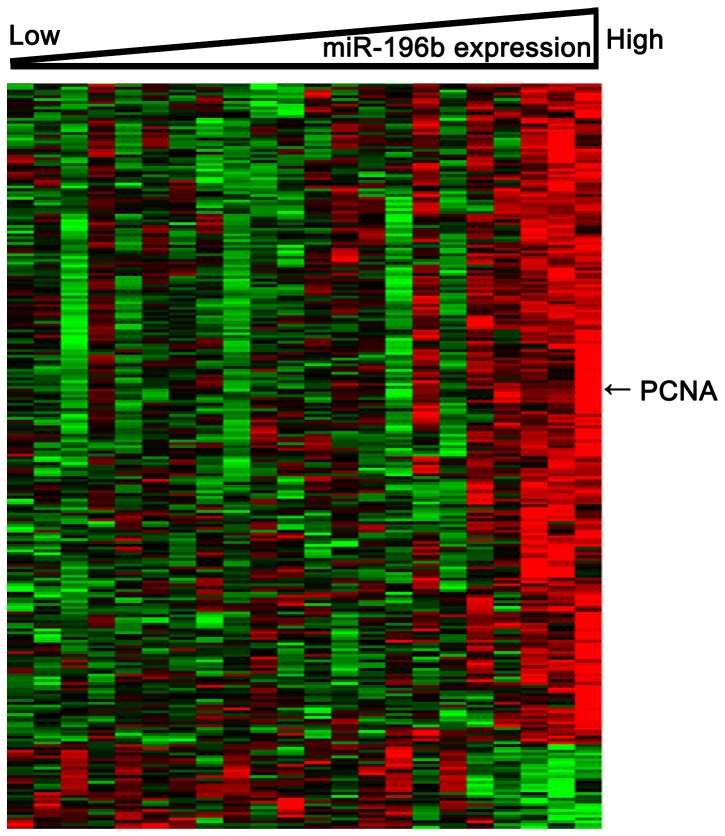
Figure 5. Heat map of the derived gene-expression signature correlated with miR-196b expression.
Total 312 negatively correlated probe sets (R<−0.4; p<0.05) and 1111 positively correlated probe sets (R>0.4; p<0.05) with miR-196b were included. Columns represent patients and rows represent probes. Patients are ordered from left to right by increasing miR-196b expression. Probes are ordered by unsupervised clustering using Cluster 3.0. Arrows indicate gene that was discussed in the text (PCNA).

