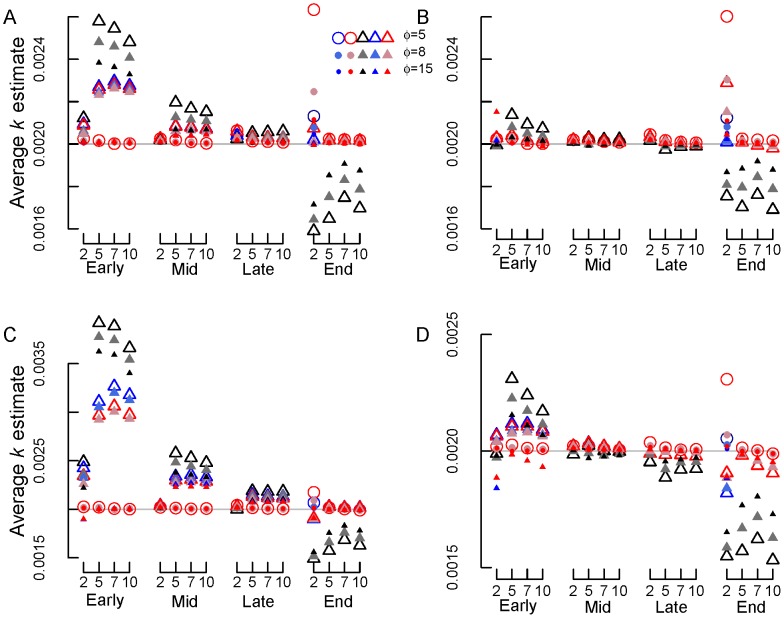
Figure 6. Average k estimates for beta-distributed errors plus normal errors with different σ and transformations.
(A) σ = 0.0125 (option 3a) and SV transformation, (B) σ = 0.0125 (option 3a) and REP transformation, (C) σ = 0.05 (option 3b) and SV transformation, (D) σ = 0.05 (option 3b) and REP transformation. Early, mid, late and end are early, mid, late and end stage decomposition simulations. The numbers 2, 5, 7 and 10 are the numbers of measurements used in each simulation. Blue circles = NLS, Red circles = Normal ML, gray/black circles = Beta ML. In most cases, nls = Normal ML so that the red circles cover the blue circles. Gray lines show the true k value of 0.002 d−1.

