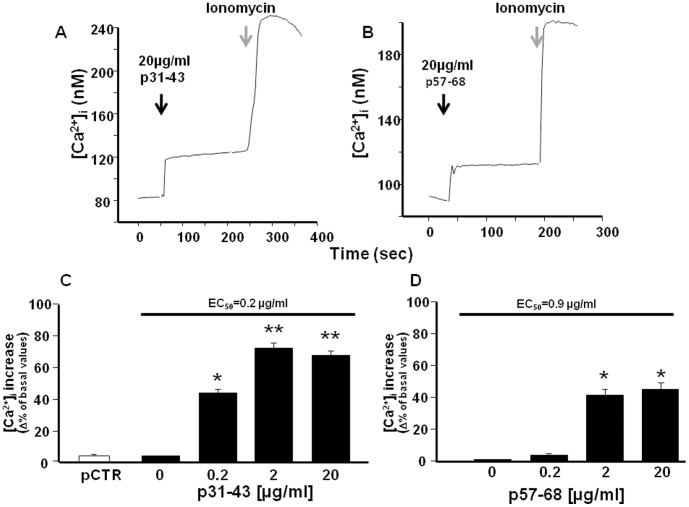
Figure 1. Effect of p31–43 and p57–68 on [Ca2+]i in Caco-2 cells.
(A) and (B) Single-cell traces representative of the effect of 20 µg/ml p31–43 and p57–68, respectively, on [Ca2+]i. Starting time of perfusion is indicated by the arrows. Ionomycin (1µM) was added as control (grey arrows) at the end of the experiment. (C) and (D) Dose-dependent effect of p31–43 and p57–68, respectively, on [Ca2+]i increase. PCTR (20 µg/ml) served as control. From 40–65 cells were monitored in each experiment. Each bar represents the mean ± SEM of data obtained in three independent experimental sessions. *p<0.05 versus its respective control (basal values); **p<0.05 versus previous concentrations and control.

