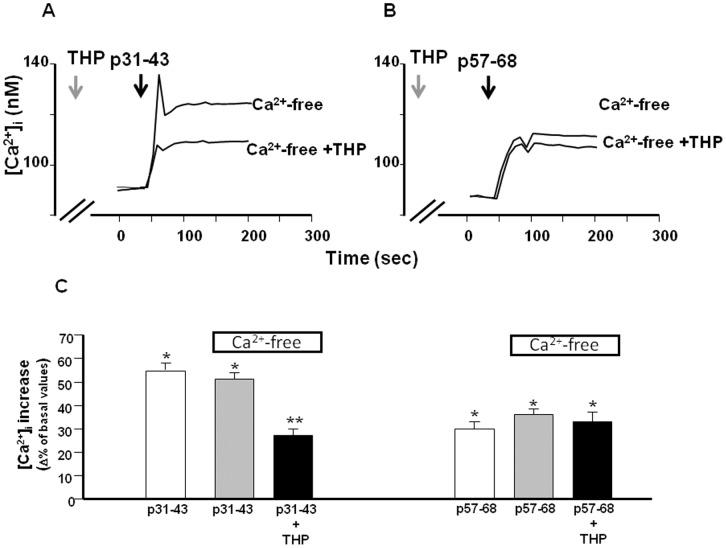
Figure 2. Effect of Ca2+-free and THP on [Ca2+]i increase induced by gliadin peptides in Caco-2 cells.
(A) and (B) Superimposed single-cell traces representative for the effect of 20 µg/ml p31–43 and p57–68, respectively, in a Ca2+-free buffer, or in a Ca2+-free buffer plus 1 µM THP, on [Ca2+]i. Before peptide perfusion (black arrows), cells were preincubated with THP for 10 min (grey arrows), to deplete ER. (C) Quantification of the effect of the treatments reported in (A) and (B) on [Ca2+]i. Each bar represents the mean ±SEM of data obtained in three independent experimental sessions. *p<0.05 versus its respective control; **p<0.05 versus peptide alone.

