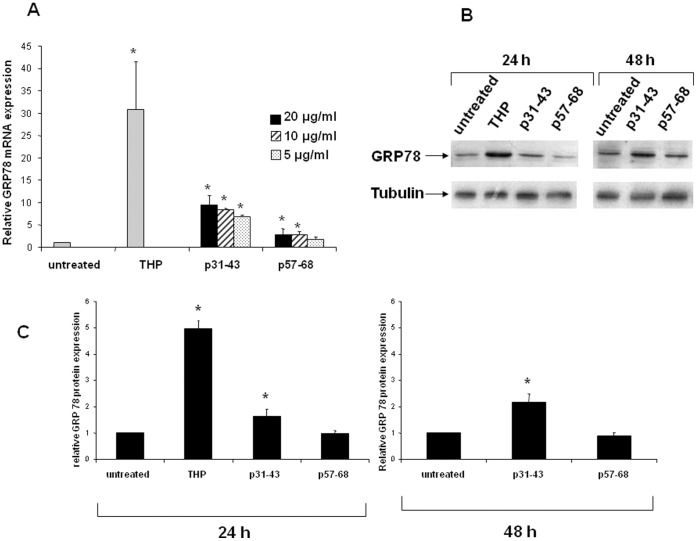
Figure 7. Analysis of GRP78 expression in Caco-2 cells.
(A) Quantification of GRP78 mRNA by real-time RT-PCR after 24 h of treatment with 1 µM THP, or 20 µg/ml p31–43 and p57–68. The amount of mRNA of GRP78 is normalized to that of GAPDH. Values are the means ± SD of at least three independent experiments. *p<0.05 versus untreated. (B) Western blot analysis of GRP78 protein level after 24 and 48 h of treatments with 20 µg/ml p31–43 and p57–68. Cells were exposed to THP (1 µM) for 24 h only. The blot shown is representative of three independent experiments. (C) Densitometric analysis (means of three independent western blot experiments). The amount of GRP78 is normalized to that of tubulin. Values are the means ± SD *p<0.05 versus untreated.

