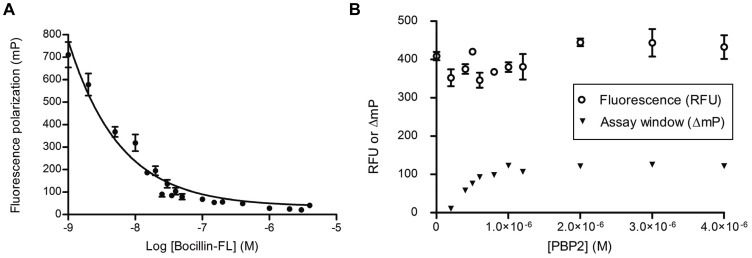
Figure 1. Optimization of the fluorescence polarization (FP) assay.
A. Fluorescence polarization (mP) of free Bocillin-FL at various concentrations from 0.002 to 4 µM. B. Binding experiments with Bocillin-FL (1 µM) and PBP 2 at various protein concentrations from 0.2 to 4 µM. Fluorescence of Bocillin-FL – PBP2 was measured in relative fluorescence units (RFU) (open circles). Maximum specific binding (triangles), i.e. assay window (ΔmP), was determined by FP. Assay window is defined as the difference between FP of protein-tracer sample and free-tracer, i.e. ΔmP = mPs – mPfree. In all experiments, the data points represent the mean ± standard deviation of four replicate experiments at each concentration of Bocillin-FL or PBP 2.

