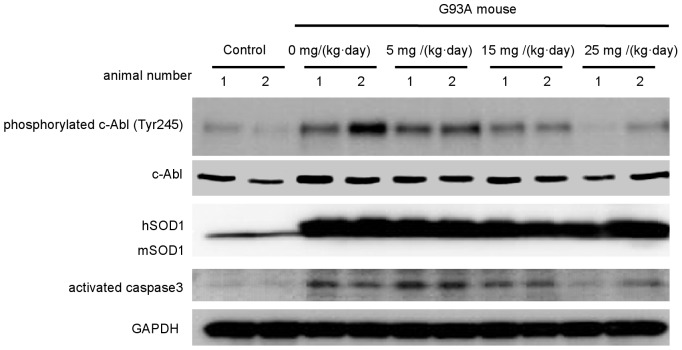
Figure 7. Dasatinib inhibits c-Abl phosphorylation in G93A mice.
Protein levels of phosphorylated c-Abl (Tyr245), c-Abl, and activated caspase-3 were measured by western blot analysis using spinal cords from dasatinib- and vehicle-treated G93A mice (120 days old). GAPDH is shown as the loading control. hSOD1 and mSOD1 indicate human SOD1 and mouse endogenous SOD1, respectively. Western blot analysis is shown in duplicate. The animal number refers to individual animals. Parallel declines in c-Abl phosphorylation and activated caspase 3 were observed.

