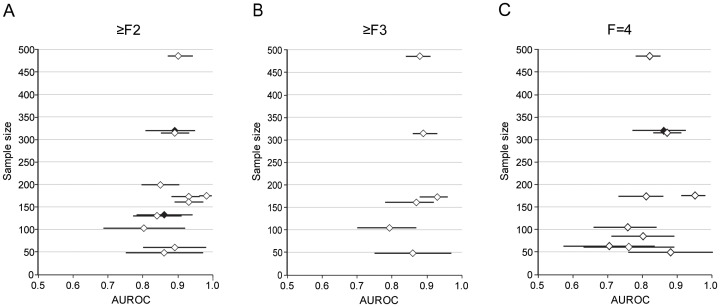
Forest plot from meta-analysis of AUROC value using a random-effect model for fibrosis stages (a) significant fibrosis (b) severe fibrosis (c) cirrhosis.
The distribution is depicted according to the sample size and the length of the horizontal line represents the 95% CI. : AUROC of the studies with patients with CHB only. : AUROC of the studies with mixed etiologies with available sub-group analysis for patients with CHB.

