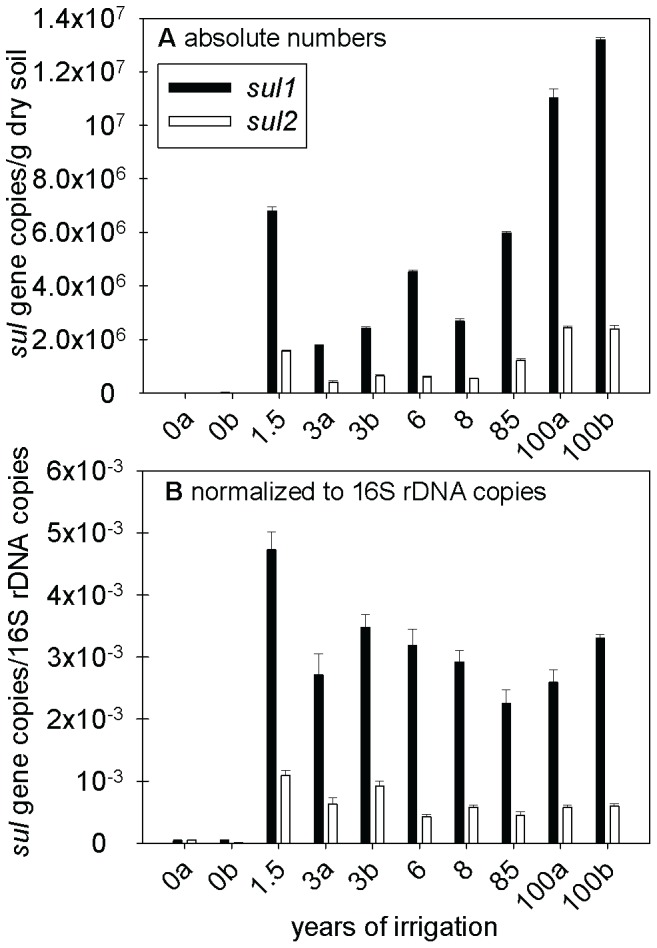
Figure 3. Absolute (panel A) and relative abundance (panel B) of sul1, sul2 resistance genes in soils.

Soils were irrigated repeatedly with untreated wastewater for different numbers of years. Error bars indicate the standard deviation between laboratory replications (three replicates) of the same composite soil sample for one field. The small letters “a” and “b” differentiate between fields that have been irrigated for the same period of time.
