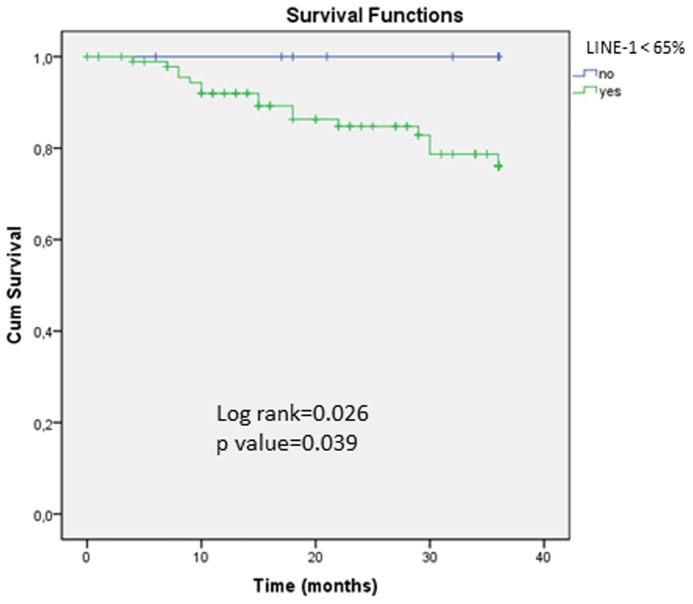
Figure 2. Kaplan–Meier survival curves depicting the effect of LINE-1 methylation on 3-year overall survival in early-onset CRC patients.
Vertical tick marks indicate censored events. The green line represents survival in CRCs with LINE-1 hypomethylation <65% (n = 92) and the blue line represents LINE-1 methylation ≥65% (n = 23). p value for log rank and Fisher’s exact test are shown.

