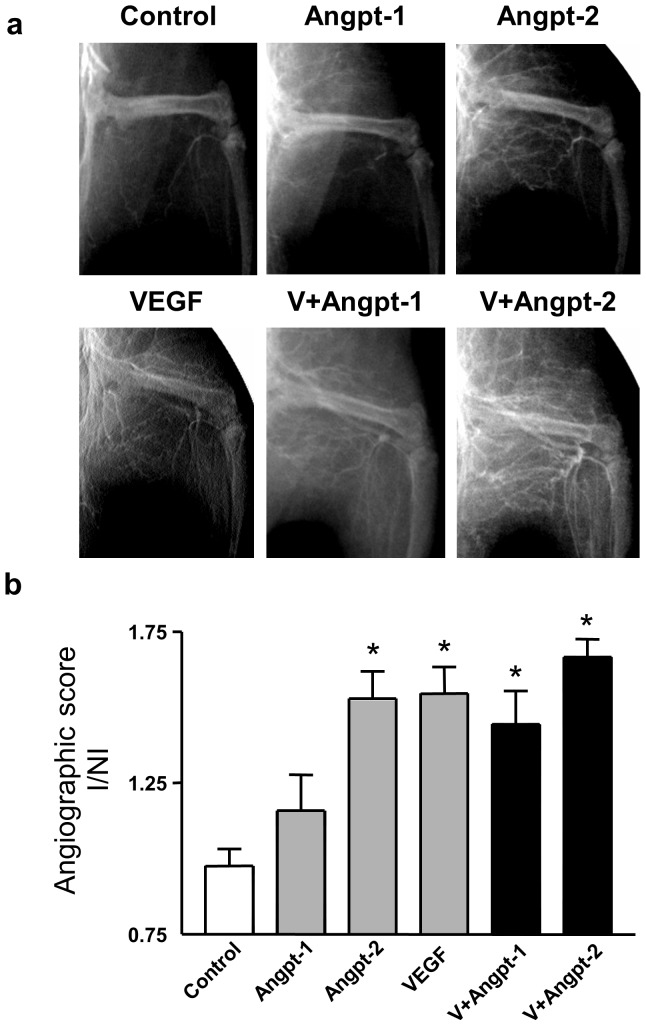
Figure 6. Hindlimb angiography and angiographic score quantitation.
(a) Representative digital angiograms of bilateral limb vasculature in the arterial phase performed 35 days after hindlimb ischemia induction. (b) Angiographic score on post-operative day 35 was expressed as a ratio of collateral number in the ischemic limb to that in the non-ischemic limb. N = 5–10. * denotes p<0.01 versus control and Angpt-1.

