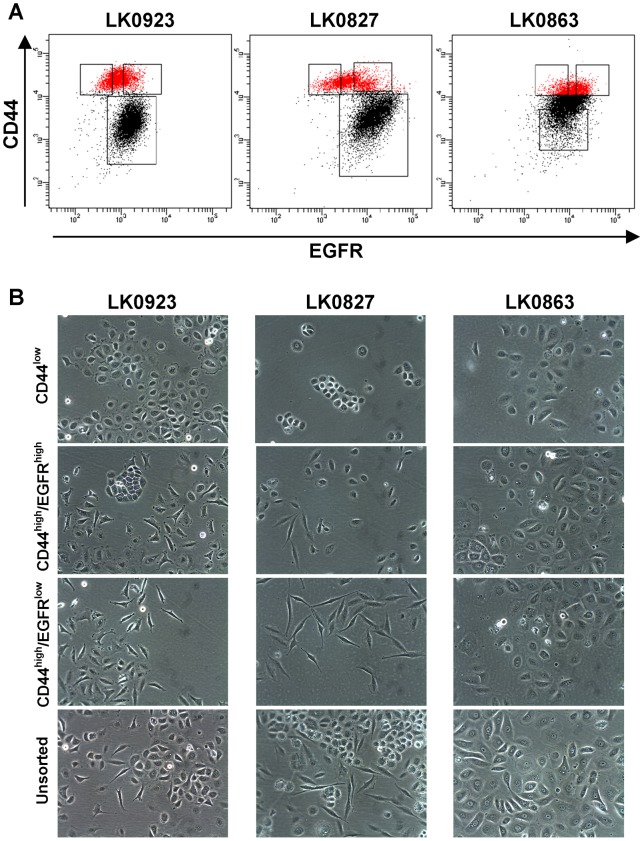
Figure 1. A: Identification of subpopulations of cells in HNSCC cell lines.
Dot plot analysis of LK0923, LK0827 and LK0863 cells co-stained with an APC-conjugated anti-CD44 antibody and a PE-conjugated anti-epidermal growth factor receptor (EGFR) antibody. The red colored areas represent the CD44high cells, and the three boxes display the gating of the different subpopulations from which cells were isolated for further experiments. B: Light microscope images of CD44low, CD44high/EGFRhigh and CD44high/EGFRlow populations (3 days after sorting) and unsorted LK0923, LK0827 and LK0863 cell cultures.

