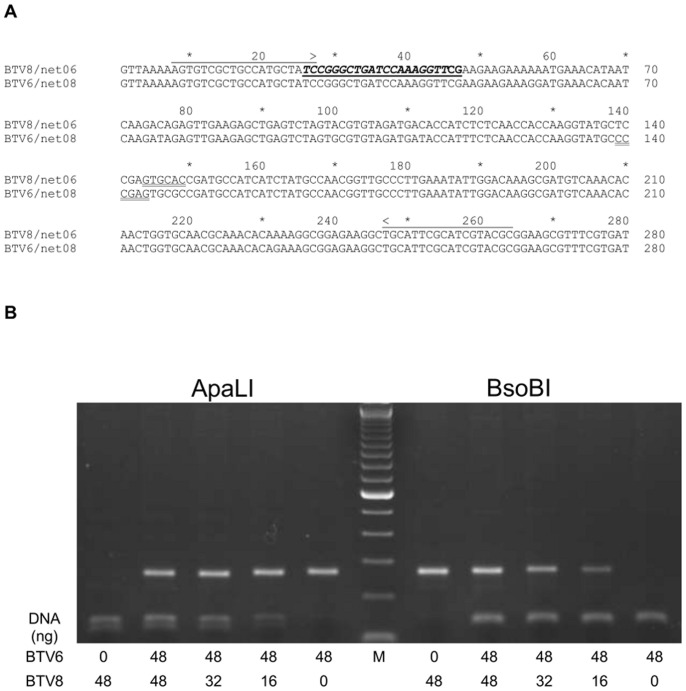
Figure 1. S10-genotyping by restriction analysis.
(A) Sequence comparison of Seg-10 amplicons of BTVac-6 and BTV8/net07. Positions and orientations of primers and probe (bold, italics, underlined) are indicated by arrows [23]. The unique restriction sites of BsoBI (CYCGRG) en ApaLI (GTGCAC) are double underlined. (B) Mixing experiment of different amounts (ng) of Seg-10 amplicon from BTV6- or BTV8 digested with BsoBI or ApaLI and analysed by electrophoresis on a 1,5% agarose gel.

