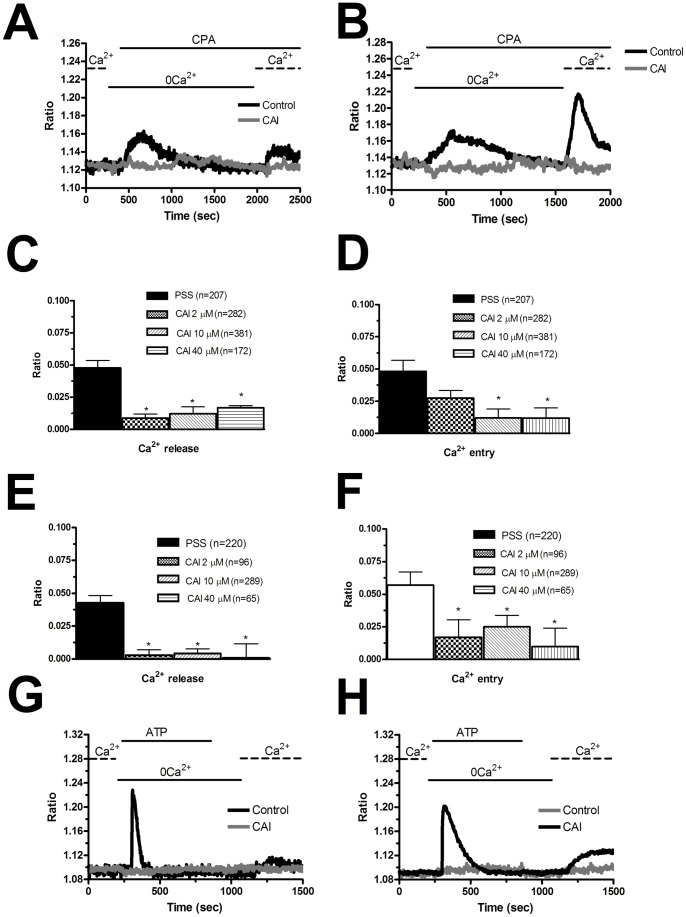
Figure 9. Carboxyamidotriazole suppresses intracellular Ca2+ signalling in endothelial progenitor cells.
A, 20 min pre-incubation with CAI (10 μM) abolishes the Ca2+ response to CPA (10 μM) in N-EPCs. B, 20 min pre-incubation with CAI (10 μM) abolishes the Ca2+ response to CPA (10 μM) in RCC-EPCs. C and D, bars indicate the mean±SE of the amplitude of CPA-elicited Ca2+ release (C) and SOCE (D) by increasing doses of CAI in N-EPCs. In Panel C, p = 0.00018 for 2 µM, p = 0.00031 for 10 µM, and p = 9.49E-24. In Panel D, p = 0.113 for 2 µM, p = 0.01643 for 10 µM, p = 0.01148 for 40 µM. All these values refer to the magnitude of the control signals. E and F, bars illustrate the mean±SE of the amplitude of CPA-induced Ca2+ release (E) and CPA-induced SOCE (F) in RCC-EPCs exposed to increasing concentrations of CAI. In Panel E, p = 0.0016 for 2 µM, p = 0.00025 for 10 µM, and p = 0.02143 for 40 µM. In Panel F, p = 5.30E-26, p = 0–02996 for 10 µM, p = 0.00947 for 40 µM. G, 10 μM CAI prevents both ATP-induced Ca2+ release and ATP-elicited SOCE in 70 N-EPCs. H, 10 µM CAI suppresses both ATP-induced Ca2+ release and ATP-elicited SOCE in RCC-EPCs.

