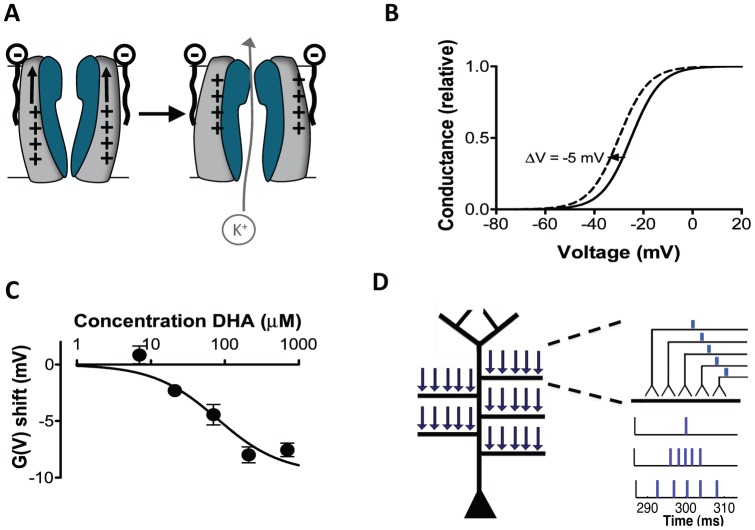
Figure 1. Conceptual background to the computational approach.
(A) Schematic illustration of PUFA modulation of ion channel voltage dependence. (B) The continuous line schematically illustrates the conductance versus voltage curve for a voltage-gated ion channel. The dashed line illustrates a PUFA-induced negative shift of the voltage dependence. (C) Dose-response curve for the PUFA (docosahexaenoic acid = DHA) induced shift of the voltage dependence of the Shaker channel expressed in Xenopus oocytes. pH = 7.4. Figure modified after Xu et al. (2008) (D) Schematic figure of the CA1 pyramidal cell and the placement of the synaptic inputs used in the simulations. The five medial to distal oblique dendrites were located 424, 500, 544, 635, and 715 µm from the soma. On each oblique dendrite, five synaptic inputs were placed (arrows). The first input cycle was set to have a midpoint at 300 ms, providing an initial period of baseline membrane potential. To represent inputs of different synchronicity levels, input arrival times were jittered using normal distributions of different widths (standard deviations).

