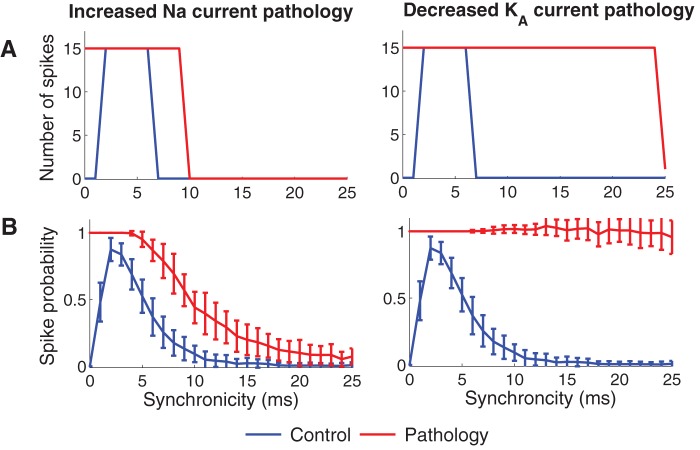
Figure 3. Pathological ion channel alterations generate hyperexcitable cell models.
The figure shows the number of spikes generated when different levels of synchronized input were provided to the cell. The left column shows the increased Na current pathology (22% increase in Na conductance). The right column shows the decreased KA current pathology (50% decrease in KA conductance). (A) Deterministic sampling model for the inputs and (B) random sampling model for inputs. Error bars indicate the standard deviation from 50 simulations. The spike counts for the control model (blue) and pathological models (red) are shown. Note that the pathological models do not reduce the cellular response to highly synchronized inputs (0–1 ms). Furthermore the decreased KA current pathology shows hyperexcitability also for lower synchronicity levels (7–24 ms).

