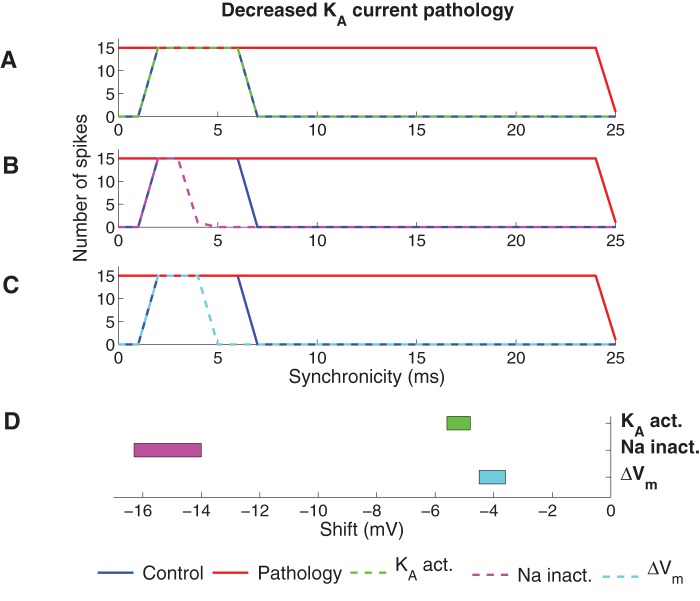
Figure 6. Effect of PUFA on the decreased KA current pathology model.
(A–C) The spike activity for the functionally corrected model when (A) KA is modulated by shifting the steady-state activation curve (−5.4 mV), (B) Na is modulated by shifting the steady-state inactivation curve (−15.4 mV) and (C) the resting membrane potential was shifted (−4.2 mV). (D) The intervals of the shift of the steady-state curves or resting membrane potential where the model was functionally corrected (generated zero spikes for synchronicity level 0 ms and 15 spikes for synchronicity level 2 ms).

