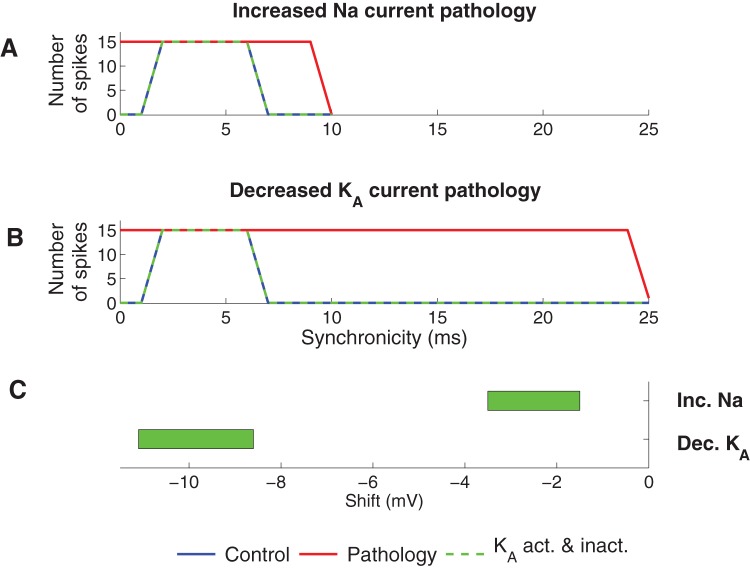
Figure 7. Effect of PUFA when the steady-state activation and inactivation of KA is equally modulated.
(A) Spike activity for the functionally corrected model of the increased Na current pathology model. (B) Spike activity for the functionally corrected model of the decreased KA current pathology model. To functionally correct the two pathologies the steady-state activation and inactivation curves of KA were shifted −3.2 mV (increased Na current pathology) and −11 mV (decreased KA current pathology). (C) Shift regions for the KA steady-state curves where the pathologies were functionally corrected (generated zero spikes for synchronicity level 0 ms and 15 spikes for synchronicity level 2 ms).

