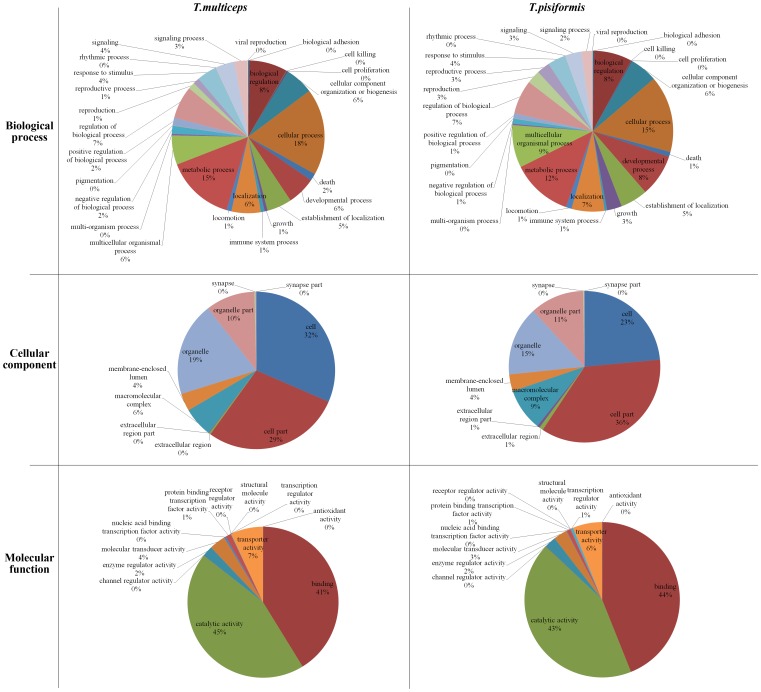
Figure 3. Transcriptomic Gene Ontology (GO) term comparison of T. multiceps and T. pisiformis.
Pie chart illustrating similarities and differences between GO terms (according to the categories ‘cellular component’ and ‘molecular function’ and ‘biological process’) assigned to peptides from T. multiceps and T. pisiformis inferred from transcriptomic data.

