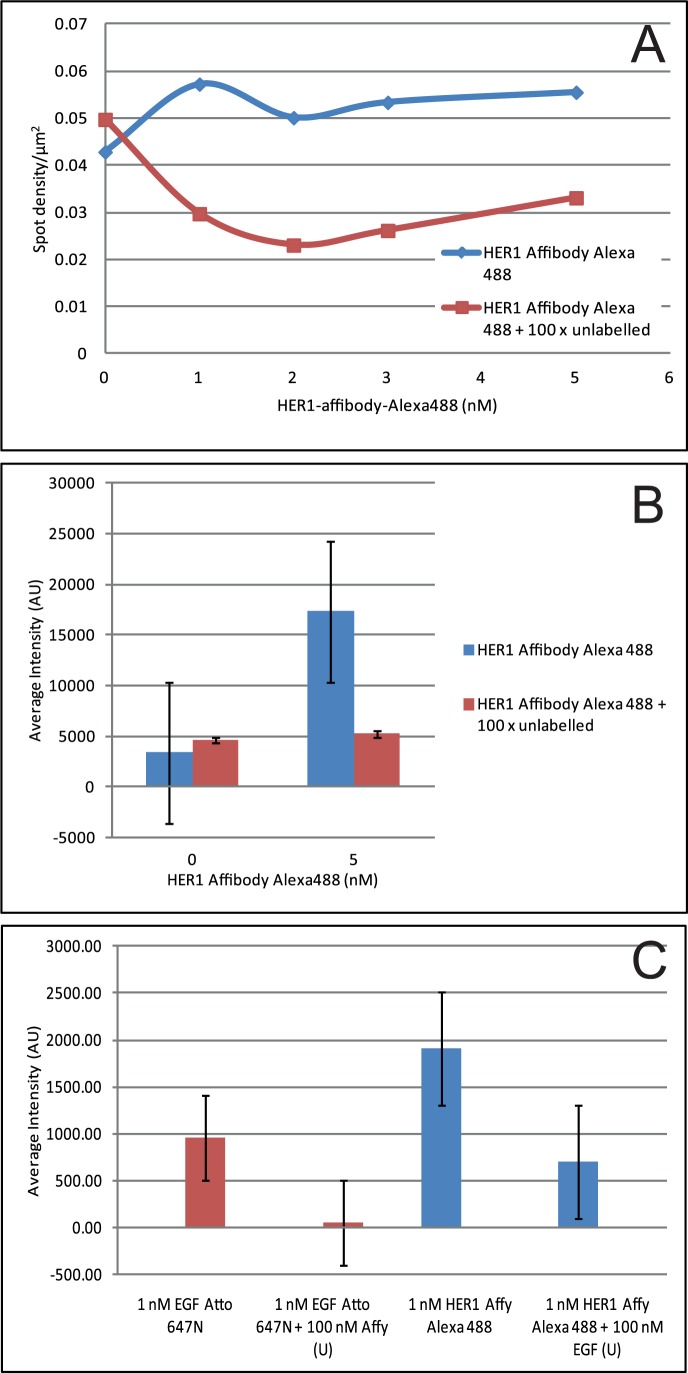
Figure 5. Determination of level of non-specific binding of labelled proteins to cells.
A) Spot density/µm2 plot for HER1 Affibody Alexa488 on T47D cells in presence (red) or absence (blue) of 100x excess unlabelled HER1 Affibody as determined by fluorescent single-molecule detection. B) Average intensity histogram of HER1 Affibody Alexa488 on A431 cells in presence (red) or absence (blue) of 100x excess unlabelled HER1 Affibody as determined by confocal imaging. C) Average intensity histogram of HER1 Affibody Alexa488 (blue) and EGF Atto 647N (red) on A431 cells in presence or absence of 100x excess unlabelled competitor.

