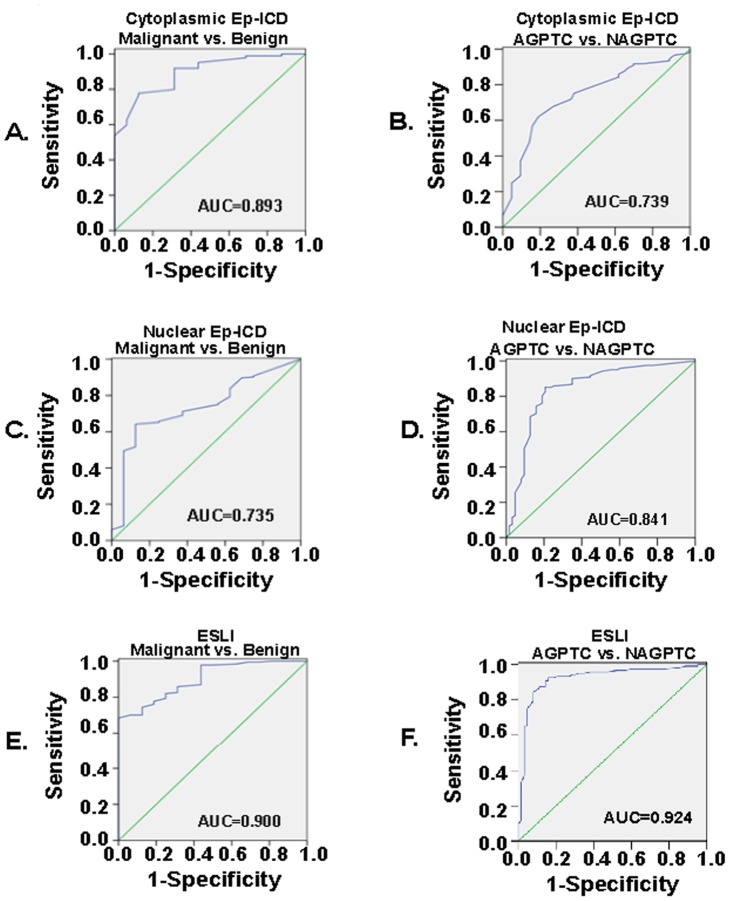
Figure 3. ROC curve analysis of cytoplasmic Ep-ICD, nuclear Ep-ICD and ESLI in thyroid tissues.
The vertical axis indicates sensitivity and the horizontal axis indicates 1-specificity. The sensitivity, specificity, and area under the curve (AUC) values for the cancers are summarized in Table 4. ROC curves for malignant vs. benign for cytoplasmic Ep-ICD (A), nuclear Ep-ICD (C) and ESLI (E). ROC curves for aggressive and non-aggressive PTC for cytoplasmic Ep-ICD (B), nuclear Ep-ICD (D) and ESLI (F). AGPTC, aggressive PTC; NAGPTC, non-aggressive PTC.

