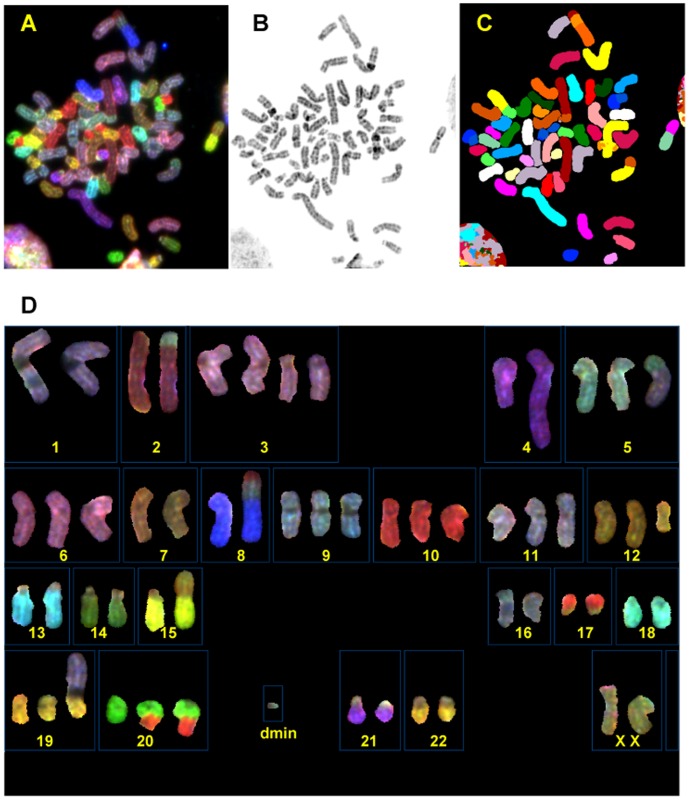
Figure 2. DKAT cell line karyotype.
A representative mitotic DKAT cell from sideline 1 is shown. A. Metaphase cell with chromosomes shown in SKY display colors. B. Inverted and contrast-enhanced DAPI image of the same metaphase cell. C. The same metaphase cell with chromosomes shown in spectra-based classification colors. D. Spectral karyotype of the same metaphase cell shown in SKY display colors.

