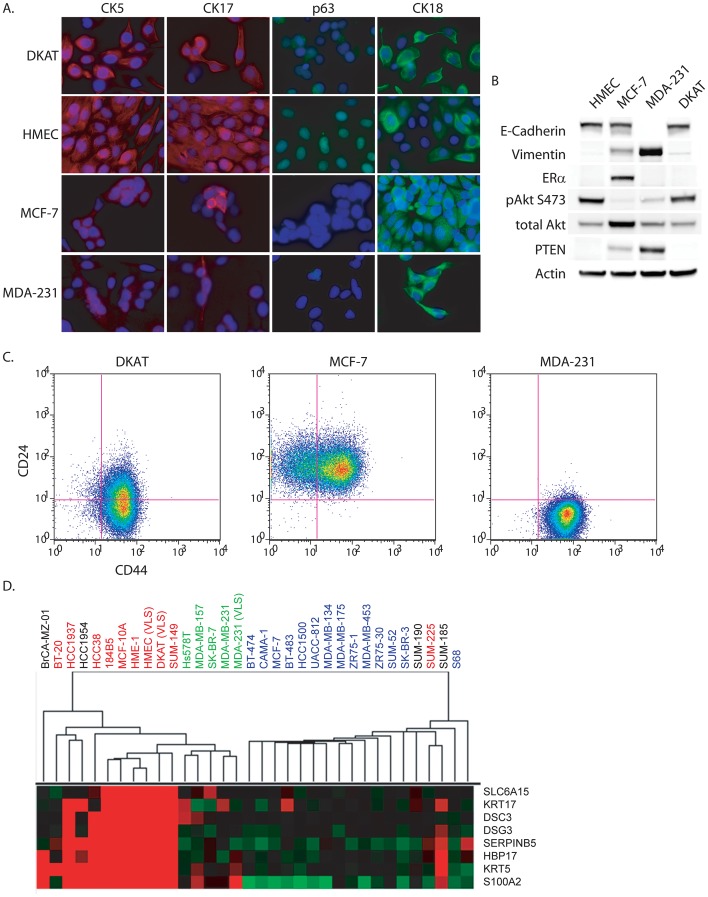
Figure 3. DKAT cells express markers of basal epithelial cells. A.
Immunofluorescence for CK5, CK17, p63 and CK18 in DKAT, immortalized HMEC, MCF-7, and MDA-MB-231 cells. B. Western blotting of total cell lysates from HMEC, MCF-7, MDA-MB-231, and DKAT cells grown in MEGM. C. FACS analysis of DKAT-MEGM, MCF-7 and MDA-MB-231 cells stained for CD44 and CD24. D. Results from DKAT, MDA-MB-231, and HMEC Affymetrix HG-U133 2+ arrays were analyzed by unsupervised hierarchical clustering with a published data set [28]. Cell lines are labeled by breast cancer subtype; luminal-like (blue); basal-like (red); mesenchymal-like (green); unknown subtype (black). Displayed is an expanded view of selected gene cluster containing basal-specific gene expression. The full gene cluster is provided as Figure S1.

