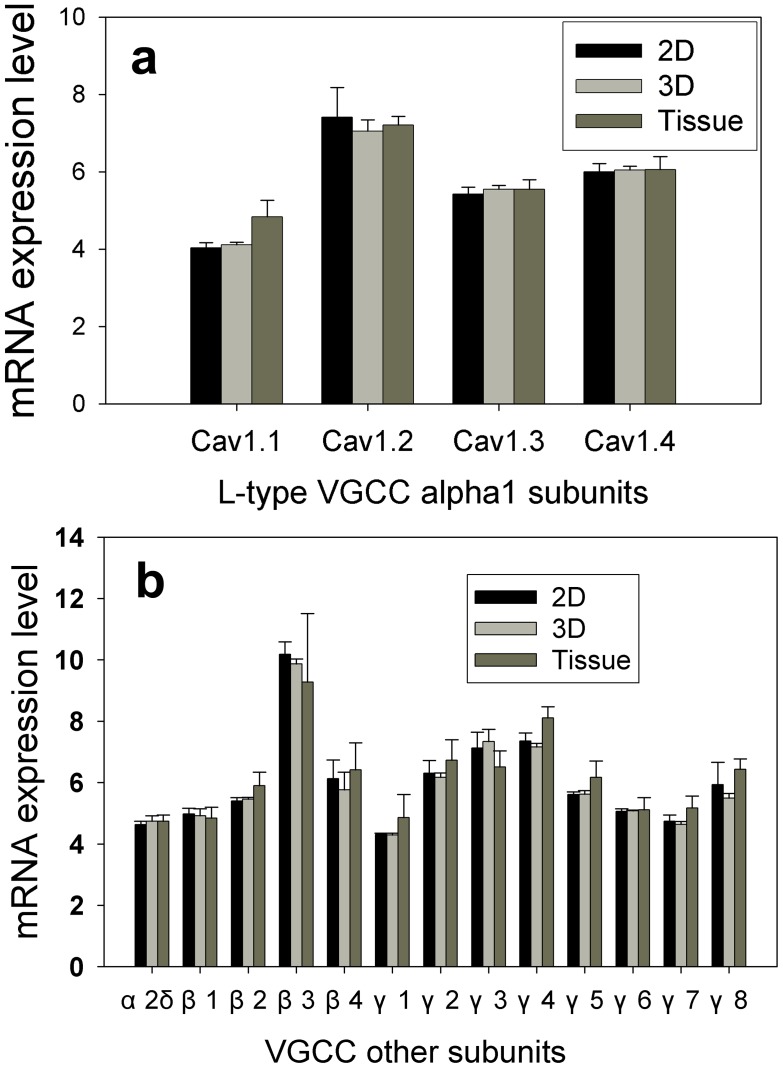
Figure 4. Microarray gene analysis results.
Whole genome analysis was performed for SCG cells in 2D and 3D after 5 days in culture or in freshly dissected SCG tissue. Gene expression levels of L-type VGCC alpha 1 subunits (a) and other common subunits in VGCC (b) are presented here. The final gene expression levels were averaged from analysis of four biological replicates in each experimental condition (2D, 3D and tissue) (n = 4). Error bars represent the standard deviation. # Indicates the mean of expression level from tissue sample was significantly different from that of 2D or 3D cultures (in PS scaffolds) with p<0.05 by Student’s t-test.

