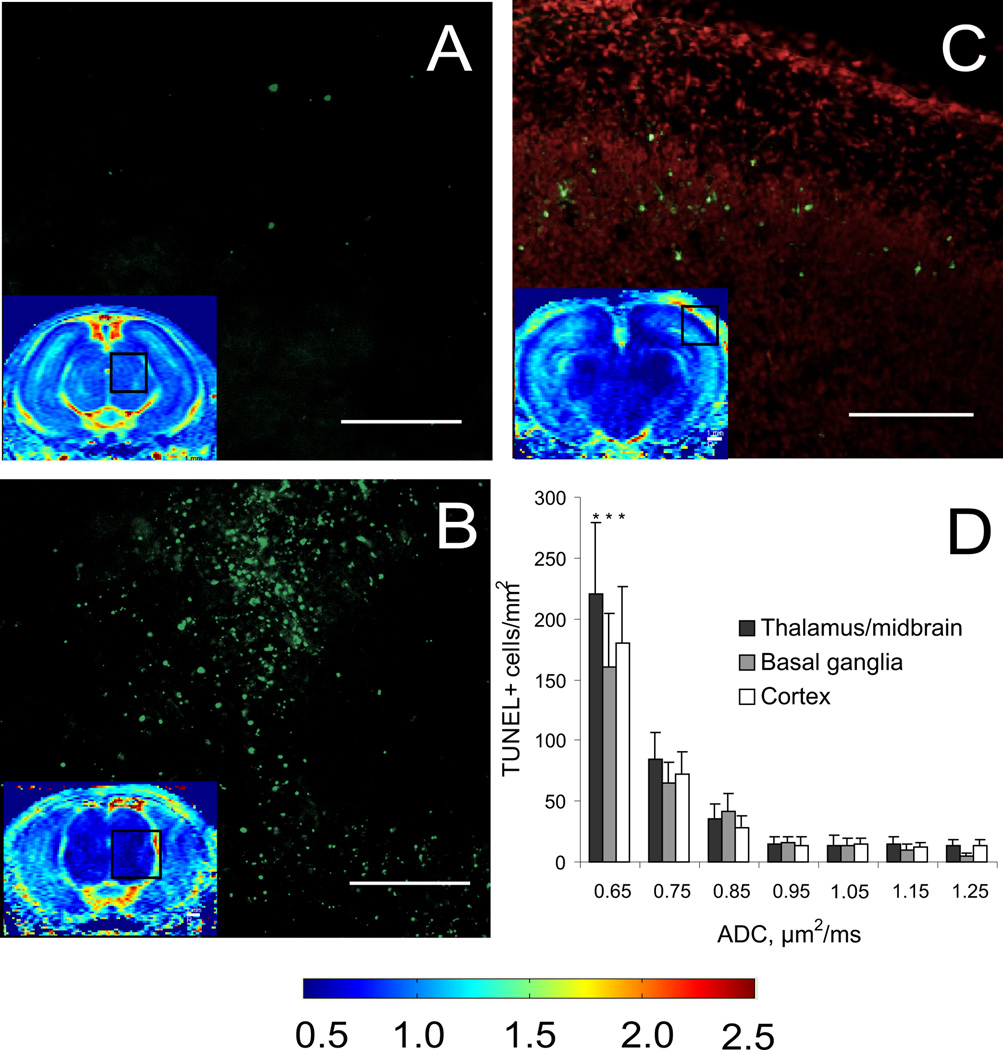
Figure 5.
Regions of injury defined by ADC decrease below threshold 0.7 µm2/ms, shown on ADC maps from the same animals (color inserts) on sections at midbrain (A,B) and thalamus (C) levels in controls (A) and hypertonic (B,C) kits, had numerous injured cells with positive TUNEL staining 24 hours after H-I injury at E29. Overlay TUNEL (green) + propidium iodide (red) (C) demonstrate that cortical injury was mostly in layer 4. The number of TUNEL positive cells was significantly higher in regions with ADC below 0.7 µm2/ms (D) in all counted gray matter regions (p<0.05, ANOVA). Color map bar units are µm2/ms. Scale bar 500 µm. Number of samples n=4/group in H-I and control groups.

