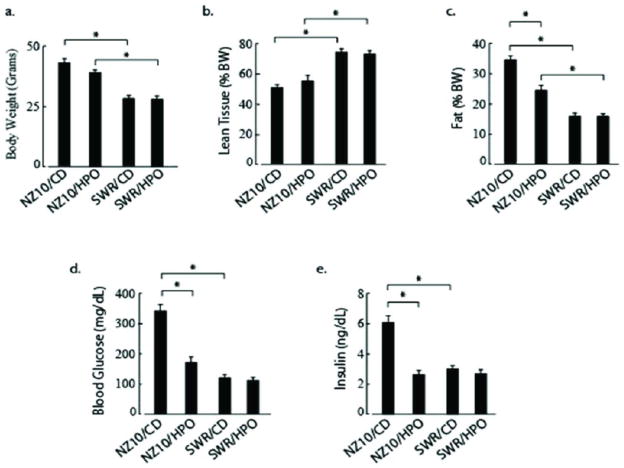
Figure 1.
Physiological and Biochemical Parameters of NZ10 and SWR mice after 19 weeks on diet. 1a. Body weight; 1b Percent lean tissue by PIXimus densitometry; 1c Percent fat by Luna PIXImus densitometry; 1d Fasting blood glucose; 1e Serum Insulin. Data represent mean ± SEM and were analyzed by 2-way ANOVA as described in Methods (* p<0.01; n=10 or larger).

