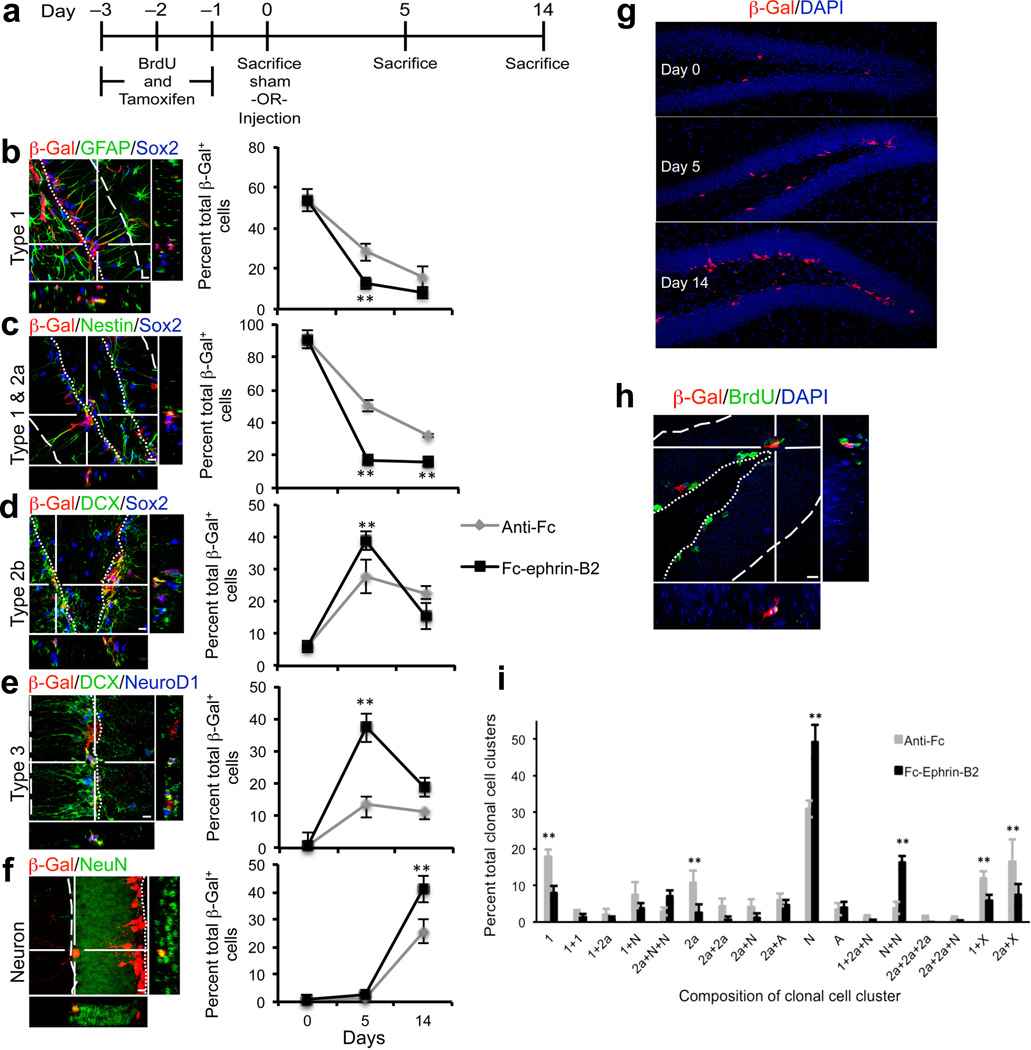
Figure 6.
Lineage tracing of ephrin-B2-induced NSC differentiation. (a) Time course where (b,c) initially 90.7 ± 1.79% of β-Gal+ cells were Nestin+/Sox2+, and 53.8 ± 5.49% were GFAP+ along radial process (Type 1 NSCs). (d,e) By day 5, 38.7 ± 2.73% and 37.3 ± 4.51% of β-Gal+ cells were Sox2+/DCX+ and DCX+/NeuroD1+, respectively, in Fc-ephrin-B2 injected mice vs. 27.7 ± 5.16% and 13.8 ± 4.38% in Anti-Fc controls. (f) At day 14, 41.1 ± 4.86% of β-Gal+ cells were NeuN+ for Fc-ephrin-B2 vs. 25.6 ± 4.24% for controls. (g,h) Representative sections where β-Gal+ and BrdU+ cells proliferated and differentiated over 14 days. (i) Compared to Anti-Fc, Fc-ephrin-B2 decreased the number of single Type 1 (“1”, 8.01 ± 1.91% vs. 17.8 ± 1.93%) and Type 2a NSCs (“2a”, 2.51 ± 2.34% vs. 10.8 ± 3.22%) and increased single neuroblast or neurons (“N”, 49.2 ± 4.57% vs. 30.9 ± 2.28%). Furthermore, ephrin-B2 decreased the number of doublets containing a Type 1 (“1+X”, 5.95 ± 1.47% vs. 11.8 ± 2.03%) or Type 2 (“2a+X”, 7.37 ± 3.00% vs. 16.5 ± 6.03%) cell and increased neuroblasts or neuron doublets (“N+N”,16.3 ± 1.82% vs. 3.87 ± 1.65%). Cluster size (1.55 ± 0.03 vs. 1.54 ± 0.04) and overall β-Gal+ cell numbers (Supplementary Fig. 5) were indistinguishable in Fc-ephrin-B2 vs. control mice. Thus, ephrin-B2 signaling increases neuronal differentiation without altering proliferation. ** P <0.05; ± s.d; Five sections (10 hemispheres) analyzed in n = 4 Anti-Fc and 5 Fc-ephrin-B2 brains; dotted vs. dashed lines mark SGZ/Hilus vs. GCL/MCL boundaries.

