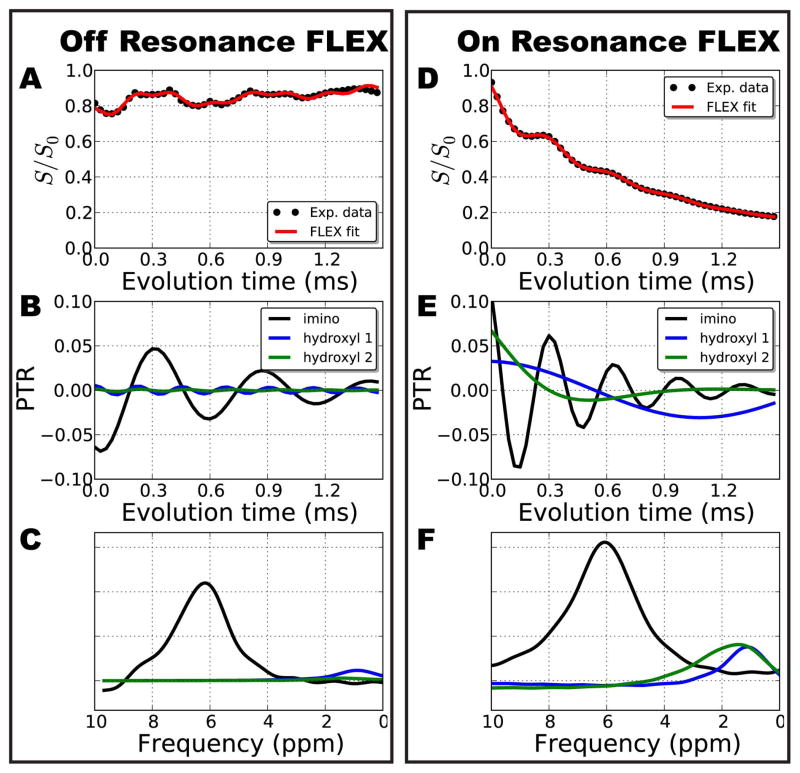
Figure 3.
Comparison of the data processing steps between off–resonance and on resonance FLEX for the pH 6.2 solution of thymidine. For off-resonance excitation the water signal intensity modulates around S/S0 ~ 0.8 as a function of tevol (A). The fitted components (Eq. 1) corresponding to the imino NH protons, hydroxyl protons at 1.0 ppm, and hydroxyl protons at 1.4 ppm of thymidine is shown in B. (C) A FLEX spectrum obtained by Fourier transforming the FLEX time domain signals in B. (D) The signal for on resonance FLEX experiments modulates about an exponential decay due to significant additional echoes generated by the train of labeling pulses. (E) Deconvolved FLEX time domain signal from the three solute pools; (F) corresponding resonance frequencies. Notice that the modulation frequencies shown in B and E differ because of the different Δωs,o1, for the two experiments, but that the same resonance frequency results in the final spectrum referenced to the water resonance frequency (C and F). FLEX fit parameters are in Table 2.

