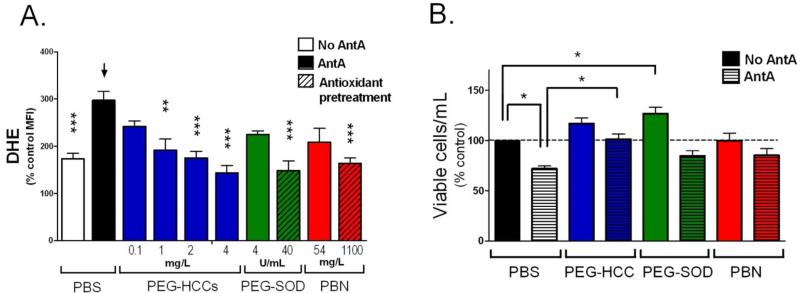
Figure 2.
PEG-HCCs protect brain endothelial cells from oxidative stress when administered after an insult. (A) Intracellular ROS levels for b.End3 cells as determined by DHE staining and flow cytometry. The mean fluorescent intensity (MFI) of 10,000 cells/group was normalized to the group not treated with antimycin A (AntA in graphs) or DHE. Phosphate buffered saline (PBS, black bar) or antioxidant treatments (blue, green, and red solid bars) were given after antimycin A. Some antioxidants were administered prior to antimycin A (striped bars). Additional controls are shown in Figure S2. * p-value < 0.05; ** p-value < 0.01; *** p-value < 0.001 compared to bar with arrow. Results are a mean of five separate experiments. (B) Cell survival relative to control for b.End3 cells given different treatments. The cells were either cultured in the presence of PEG-HCCs, PEG-SOD or PBN alone (solid bars) or the cells were first treated with a dose of antimycin A titrated to kill 30% of the cells followed by treatment with PEG-HCCs, PEG-SOD or PBN (striped bars). Results are a mean of seven separate experiments. Error bars are s.e.m. ANOVA with Bonferroni post test was used to calculate statistics. * p-value <0.05.

