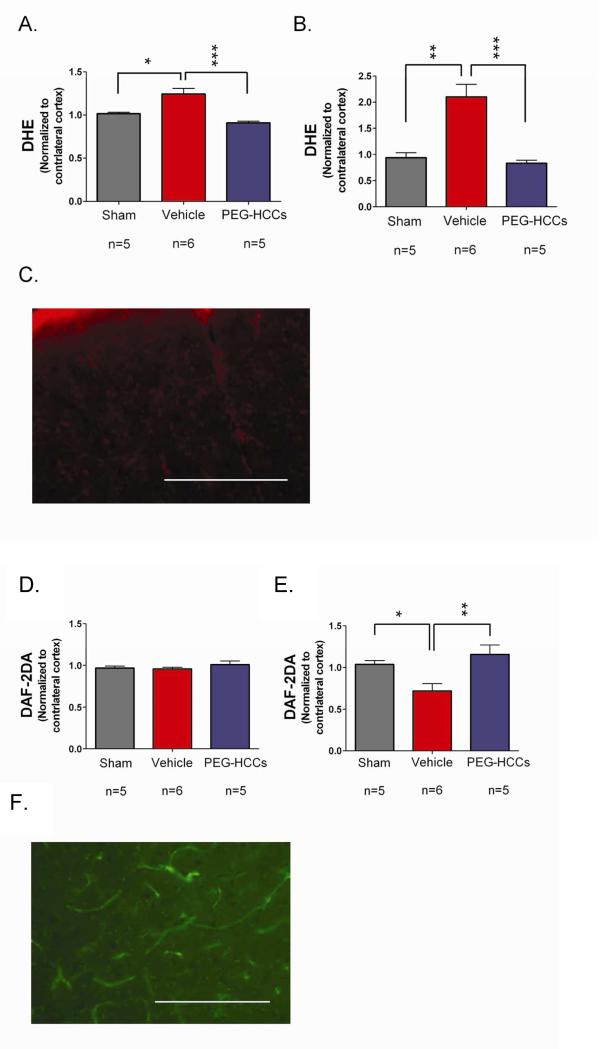
Figure 4.
Fluorescence after systemic injection of radical-sensitive dyes measured in the brain and vasculature following TBI. DHE levels (proportional to SO and oxidative radicals) in the (A) brain parenchyma (cortex) and (B) blood vessels of sham (no TBI) surgery rats or rats with TBI + hypotension with vehicle or PEG-HCC treatment. The ipsilateral cortex (brain hemisphere with TBI) was normalized to the contralateral cortex. PEG-HCC treatment was able to reduce DHE staining (blue column) compared to vehicle treatment (red column), with a larger magnitude of effect seen in the blood vessels than the brain parenchyma, suggesting that the cerebrovascular is likely the site of major dysfunction in the TBI model. (C) Microscopy of DHE staining (red) in the injured cortex; scale bar = 200 μm showing the prominent fluorescence in vascular structures (long thin structures). DAF-2DA levels (indicative of NO levels) are shown in (D) for the brain parenchyma (cortex) and (E) blood vessels of sham surgery rats or rats with TBI + hypotension with vehicle or PEG-HCCs treatment. (F) Microscopy of DAF-2DA staining (green) in the injured cortex. NO-related fluorescence was reduced following TBI and restored to levels comparable to the sham-treated animals. NO is important for vasodilation and increased CBF, therefore, increased DAF-2DA staining with PEG-HCC treatment correlates well with the improved CBF from Figure 3. Both DHE and DAF-2DA fluorescence was normalized in each animal to the contralateral cortex to account for minor differences in dye administration and circulation times. For all data in this Figure, error bars are S.E.M. D'Agostino-Pearson normality test was used on data and no groups had a p-value <0.05. ANOVA with Bonferroni post test was used to calculate statistics. * p-value < 0.05; ** p-value < 0.01; *** p-value < 0.001. N=5-6 animals/group with 10 brain sections analyzed per animal. Scale bar = 200 μm.

