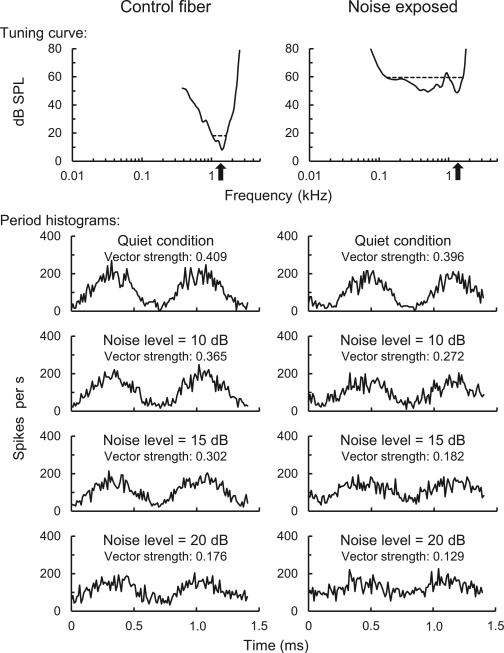
Figure 1.
Tuning curves (top panel) and period histograms of tone responses (lower panels) from a representative control fiber (left) and noise-exposed fiber (right). Upward-pointing arrows along the abscissa of tuning curves indicate characteristic frequency. Characteristic frequency, threshold, and bandwidth (measured 10 dB above threshold) were 1.41 kHz, 8 dB SPL, and 0.59 kHz, respectively, in the control fiber and 1.38 kHz, 49 dB SPL, and 1.48 kHz, respectively, in the noise-exposed fiber. Period histograms show fluctuation in mean spike rate over two cycles of the ~1.4 kHz tone stimulus. Masking condition and vector strength of phase locking to tones are specified above each histogram.

