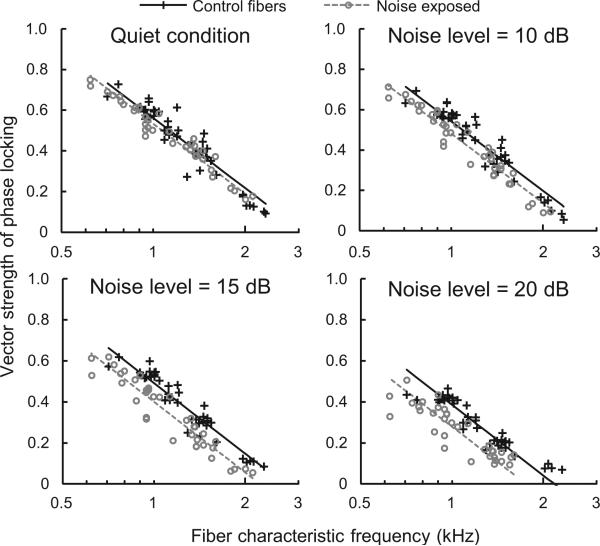
Figure 2.
A negative effect of hearing loss on phase locking to tones emerges in background noise. Scatter plots show vector strength in noise-exposed and control fibers as a function of fiber characteristic frequency under four masking conditions. The level of the masking noise (difference in dB between the RMS amplitude of the noise and tone) is given at the top of each panel. The difference in vector strength between noise-exposed and control fibers (least squares mean ± standard error) was –0.028 ± 0.011 in quiet (P = 0.016), –0.061 ± 0.012 in 10 dB noise (P < 0.001), –0.091 ± 0.012 in 15 dB noise (P < 0.001), and –0.106 ± 0.012 in 20 dB noise (P < 0.001).

