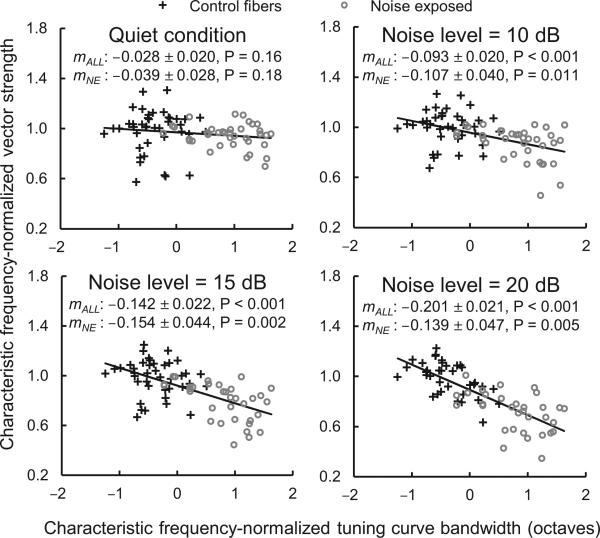
Figure 3.
Noise-exposed fibers with broader tuning exhibit greater reductions in vector strength. Scatter plots show characteristic frequency-normalized vector strength (vector strength divided by the mean vector strength of control fibers at the same characteristic frequency) as a function of characteristic frequency-normalized tuning curve bandwidth (the octave difference from the mean bandwidth of control fibers at the same characteristic frequency [from Ref. 7]). The level of the masking noise (difference in dB between the RMS amplitude of the noise and tone) is given at the top of each panel followed by the slope of the regression line ± standard error and its statistical significance. We conducted analyses using both data from all fibers (mALL) and data from noise-exposed fibers only (mNE). Trend lines are based on data from all fibers.

