
Figure 5.
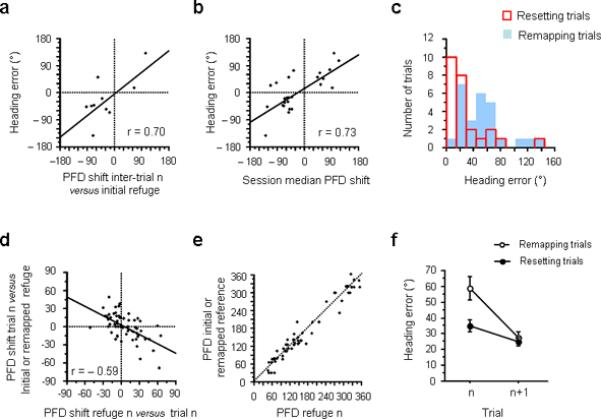
The correction process. a, Heading error as a function of the cell's PFD shift between the current inter-trial interval and the initial refuge (Mode 2 inter-trials). b, Heading error observed in remapping trials, as a function of the session median PFD shift compared to its initial refuge value. c, Distribution of heading errors for resetting (red) and remapping (blue) trials. d, PFD shift in trial n (compared to initial or remapped refuge value) as a function of the PFD shift between trial n and the following inter-trial interval (refuge n). e, PFD recorded during the inter-trial interval n compared to the initial or remapped refuge value. f, Comparison of heading errors made by the animals before (trial n) and after (trial n+1) remapping (white dots) and resetting (black dots).