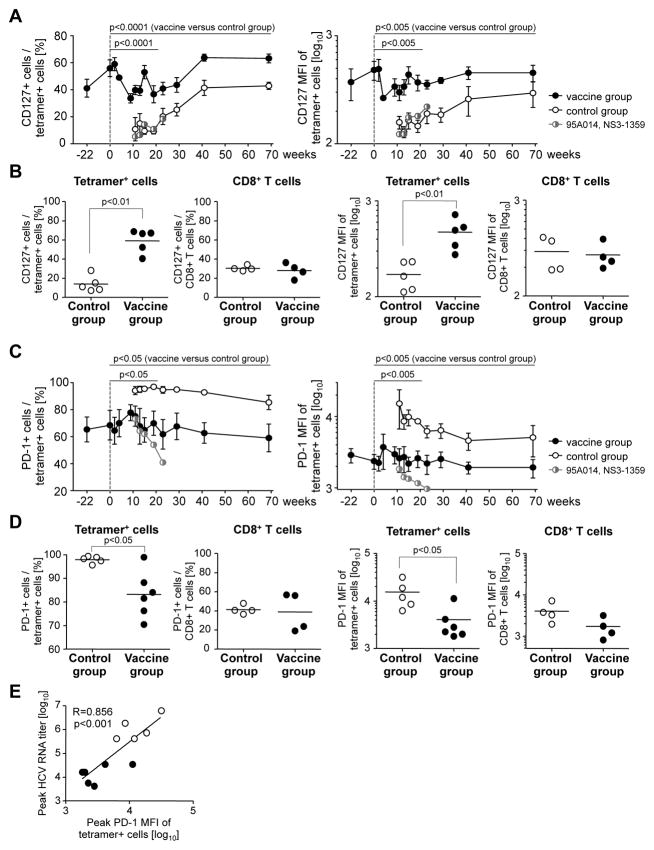
Figure 3. Vaccine-induced HCV-specific CD8 T cells express more CD127 and less PD-1 than infection-induced HCV-specific T cells.
(A, C) Frequency and MFI of CD127+ cells and CD127 MFI (A) and frequency of PD-1+ cells and PD-1 MFI (C) in the HCV-specific tetramer+ CD8 T cell population. Graphs show mean + SEM for each group. Serial measures ANOVA is used to compare these parameters for vaccine-induced HCV-specific CD8 T cells from the vaccinated chimpanzees (filled circles) and infection-induced HCV-specific CD8 T cells from the control chimpanzees (open circles) in the acute phase of hepatitis (up to week 19) and the entire time course. Infection-induced NS31359-specific T cells of the vaccinated chimpanzee 95A014 are shown by half-filled, half-open circles. (B, D) Increased CD127 (B) and decreased PD-1 expression (D) is limited to HCV-specific T cells of the vaccinated chimpanzees and not seen on bulk CD8 T cells. Vaccinated and control chimpanzees are compared at the time with the highest percentage of CD127+ HCV-specific T cells (B) and the highest MFI of PD-1 + HCV-specific T cells (D). The horizontal line indicates the geometric mean. NS31359-specific T cells of vaccinee 95A014 were excluded from the analysis, because these cells were induced by infection rather than the vaccine. See supplementary figure 2 for FACS dot plots. (E) Correlation between PD-1 expression and viremia. Filled symbols, vaccines; open symbols, mock-vaccinated control chimpanzees. R, correlation coefficient.

