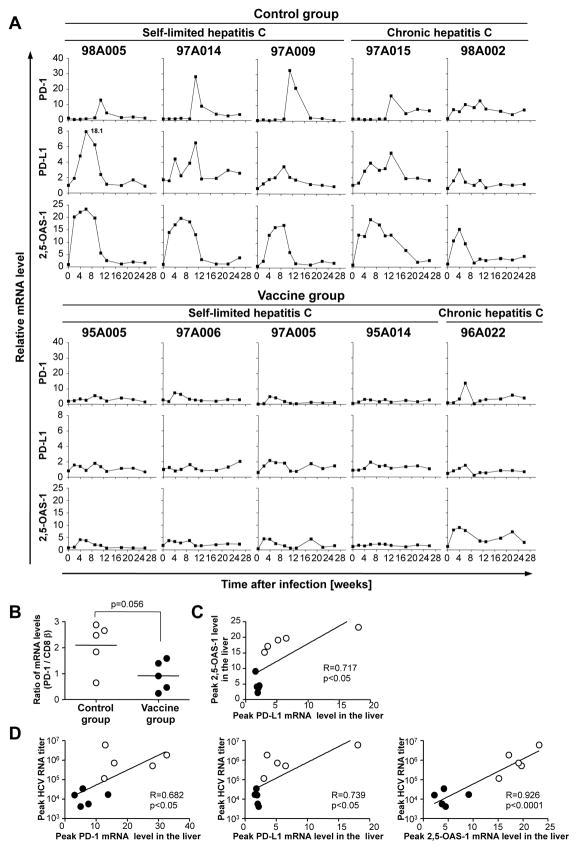
Figure 6. Intrahepatic PD-1, PD-L1, and 2,5-OAS-1 mRNA expression levels throughout the course of HCV-challenge.
(A) Intrahepatic PD-1, PD-L1, and 2,5-OAS-1 mRNA levels normalized to endogenous references (β-actin, GAPDH and β7) and expressed as fold-increase over pre-infection levels. (B) Peak PD-1 mRNA levels, normalized to CD8β mRNA levels, respectively, differed between control mock-vaccinated chimpanzees and vaccinees. (C, D) Linear regression analysis between peak intrahepatic PD-L1 and 2,5-OAS-1 mRNA levels (C), and between peak HCV RNA titers and peak intrahepatic PD-1, PD-L1 and 2,5-OAS-1 mRNA levels respectively (D). Open circles, mock-vaccinated control chimpanzees; filled circles, vaccinees. R, correlation coefficient.

