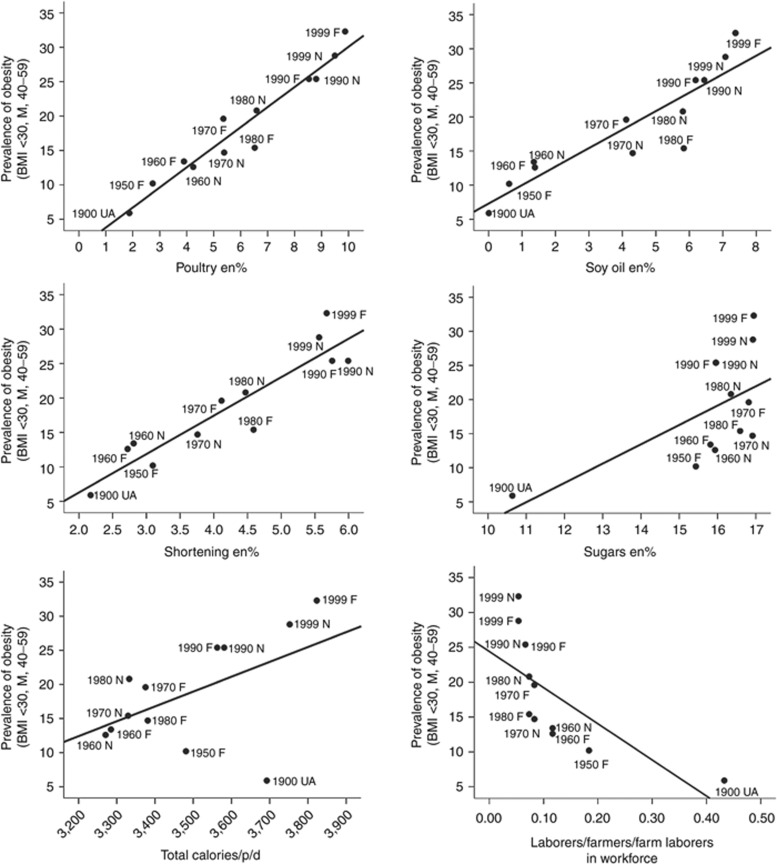
Figure 5.
Dietary sources of linoleic acid (LA) and increasing prevalence rates of male obesity in the United States during the 20th century. Prevalence of male obesity (40–59 years, BMI >30) in each year is indicated by source: UA-Union Army Veterans, F-Framingham cohorts, N-NHANES cohorts. Scattergrams and univariate linear regression lines are indicated in each panel. Increasing prevalence rates of male obesity are positively correlated with apparent consumption of dietary sources of LA indicated in (a) poultry a percent of energy (en%), (r2 = 0.94, P < 0.000000), (b) soybean oil (en%) (r2 = 0.82, P < 0.00005), (c) shortening (en%) (r2 = 0.86, P < 0.00002), and (d) sugars (en%) (r2 = 0.37, P < 0.04) but not to (e) total calories/p/d (r2 = 0.27, P < 0.08). Prevalence of obesity is negatively correlated with (f) declines in physical labor occupations, farmers, farm laborers, and laborers (r2 = 0.49, P < 0.01). Animal diets of 1 en% and 8 en% LA were selected to model these changes.

