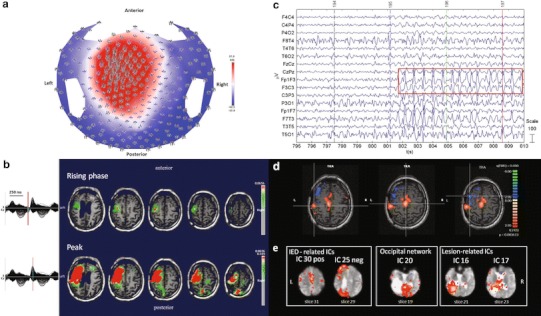
Fig. 1.

Patient No. 1. a HdEEG signal visualized according to the projected locations of the scalp electrodes (spike average). b HdEEG source analysis results. On the left, 256-channel EEG traces with a duration of 1 s (spike average). The global field power is used for the onset (red line). On the right, EEG source imaging in the rising phase of the peak and at the peak. The maximum of the estimated source of the average interictal spike is indicated in red. c EEG acquired during fMRI scanning after preprocessing. d EEG-fMRI results from the GLM analysis. Corrected p value (FDR, p < 0.05) is visualized, and the color bar shows the Z score scale. e EEG-fMRI results from the ICA analysis. The maps were thresholded at a posterior probability threshold of p > 0.5
